India’s Mutual Fund Flows – Jan 2026: Total Mutual Fund assets rise by 1% to Rs 81.01 (80.23) lakh crs

Inflows in Gold ETFs see a massive jump from 11,646 crs to 24,039 crs.

Inflows in debt and Multi Asset Allocation Funds also lead to increase in assets.

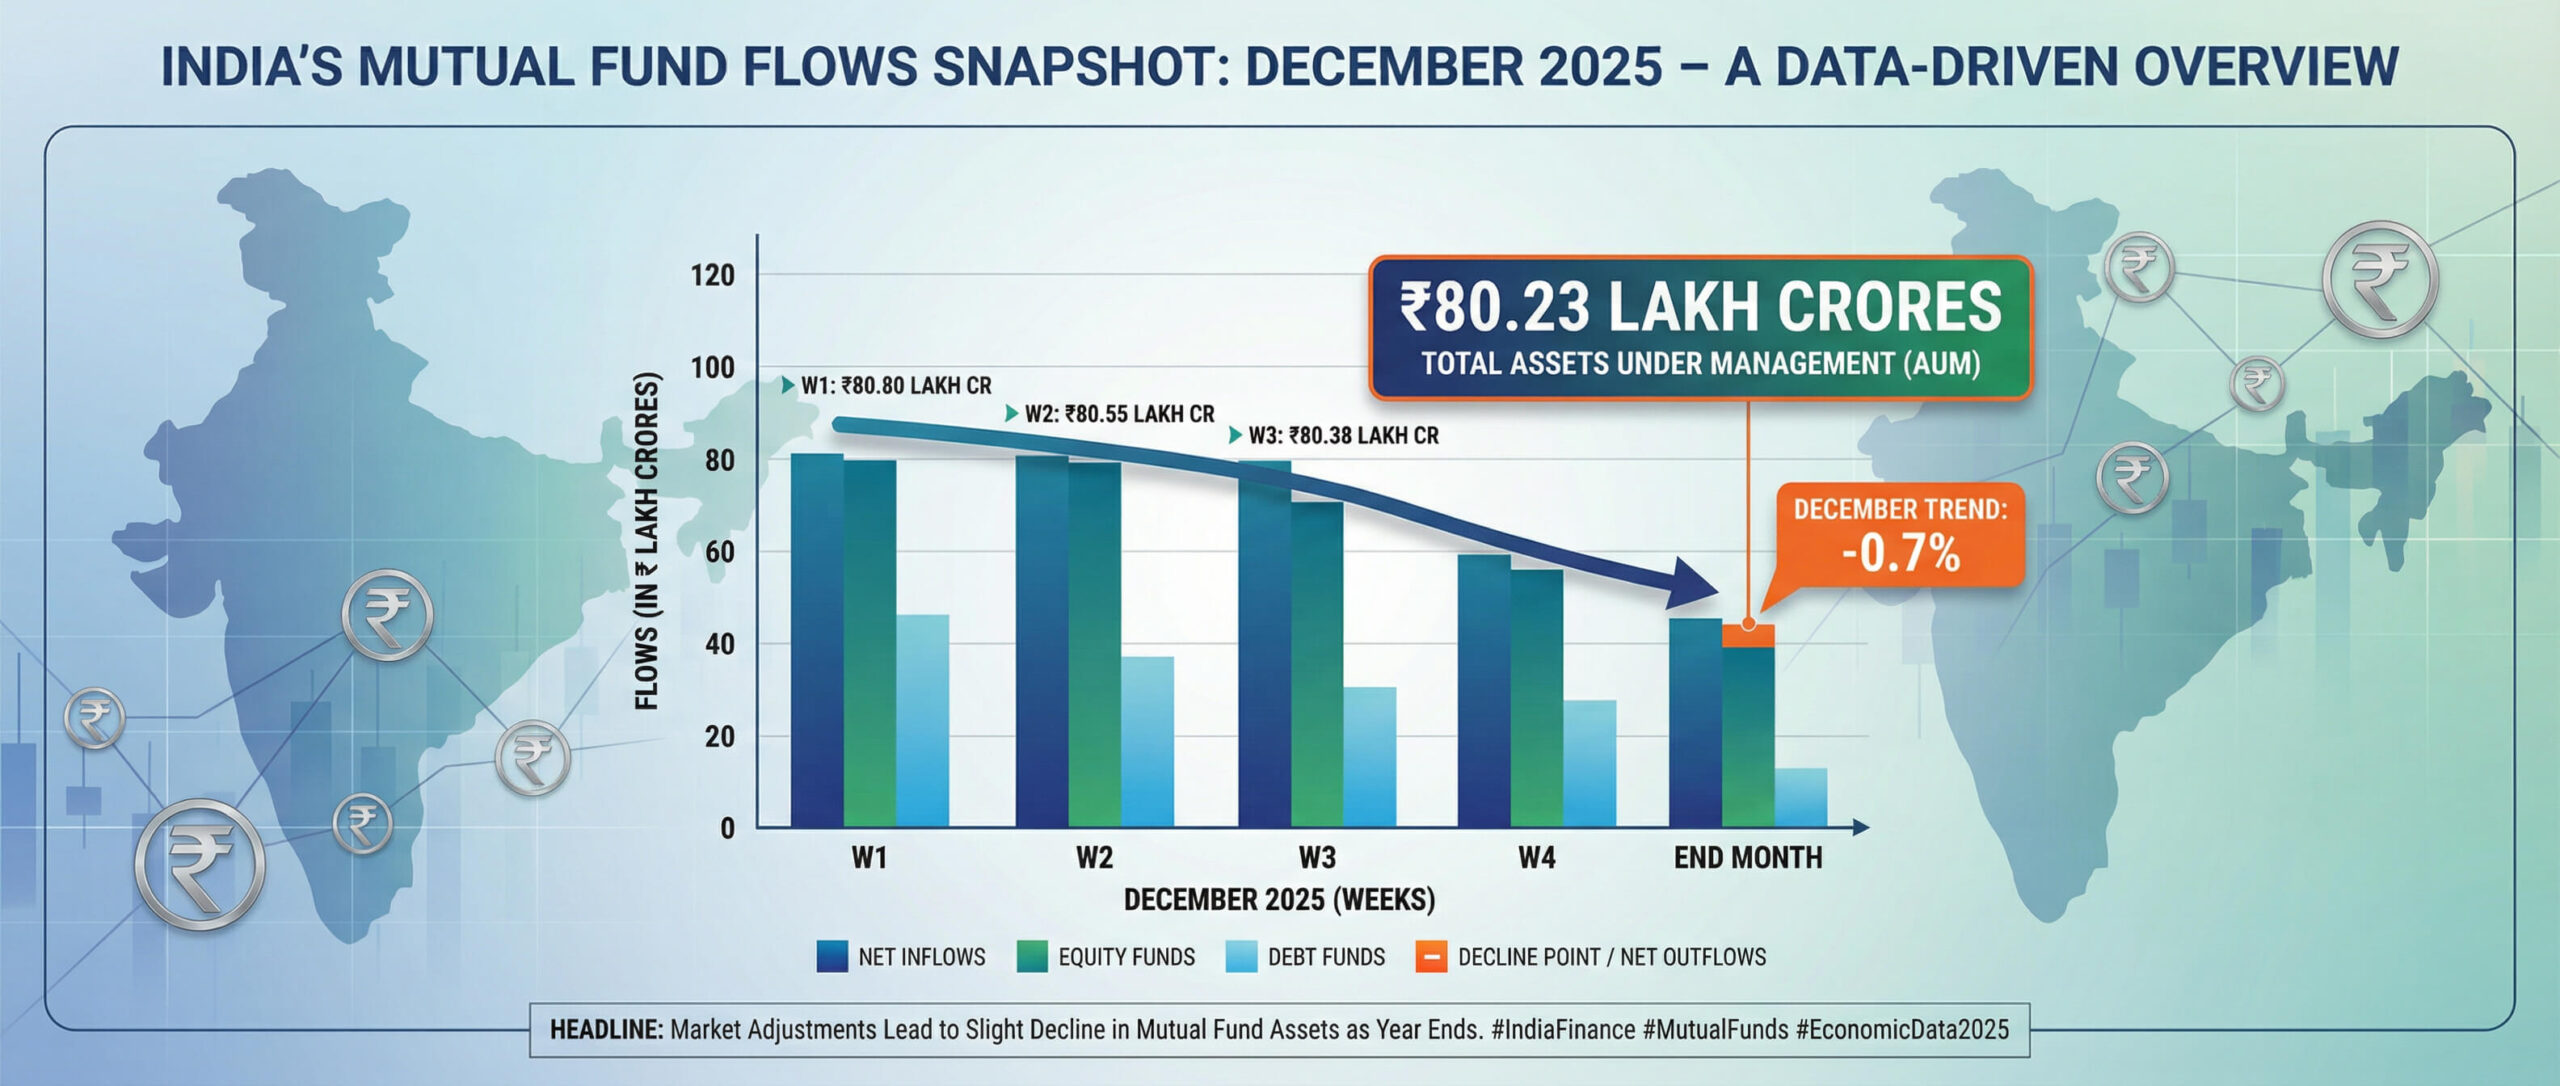
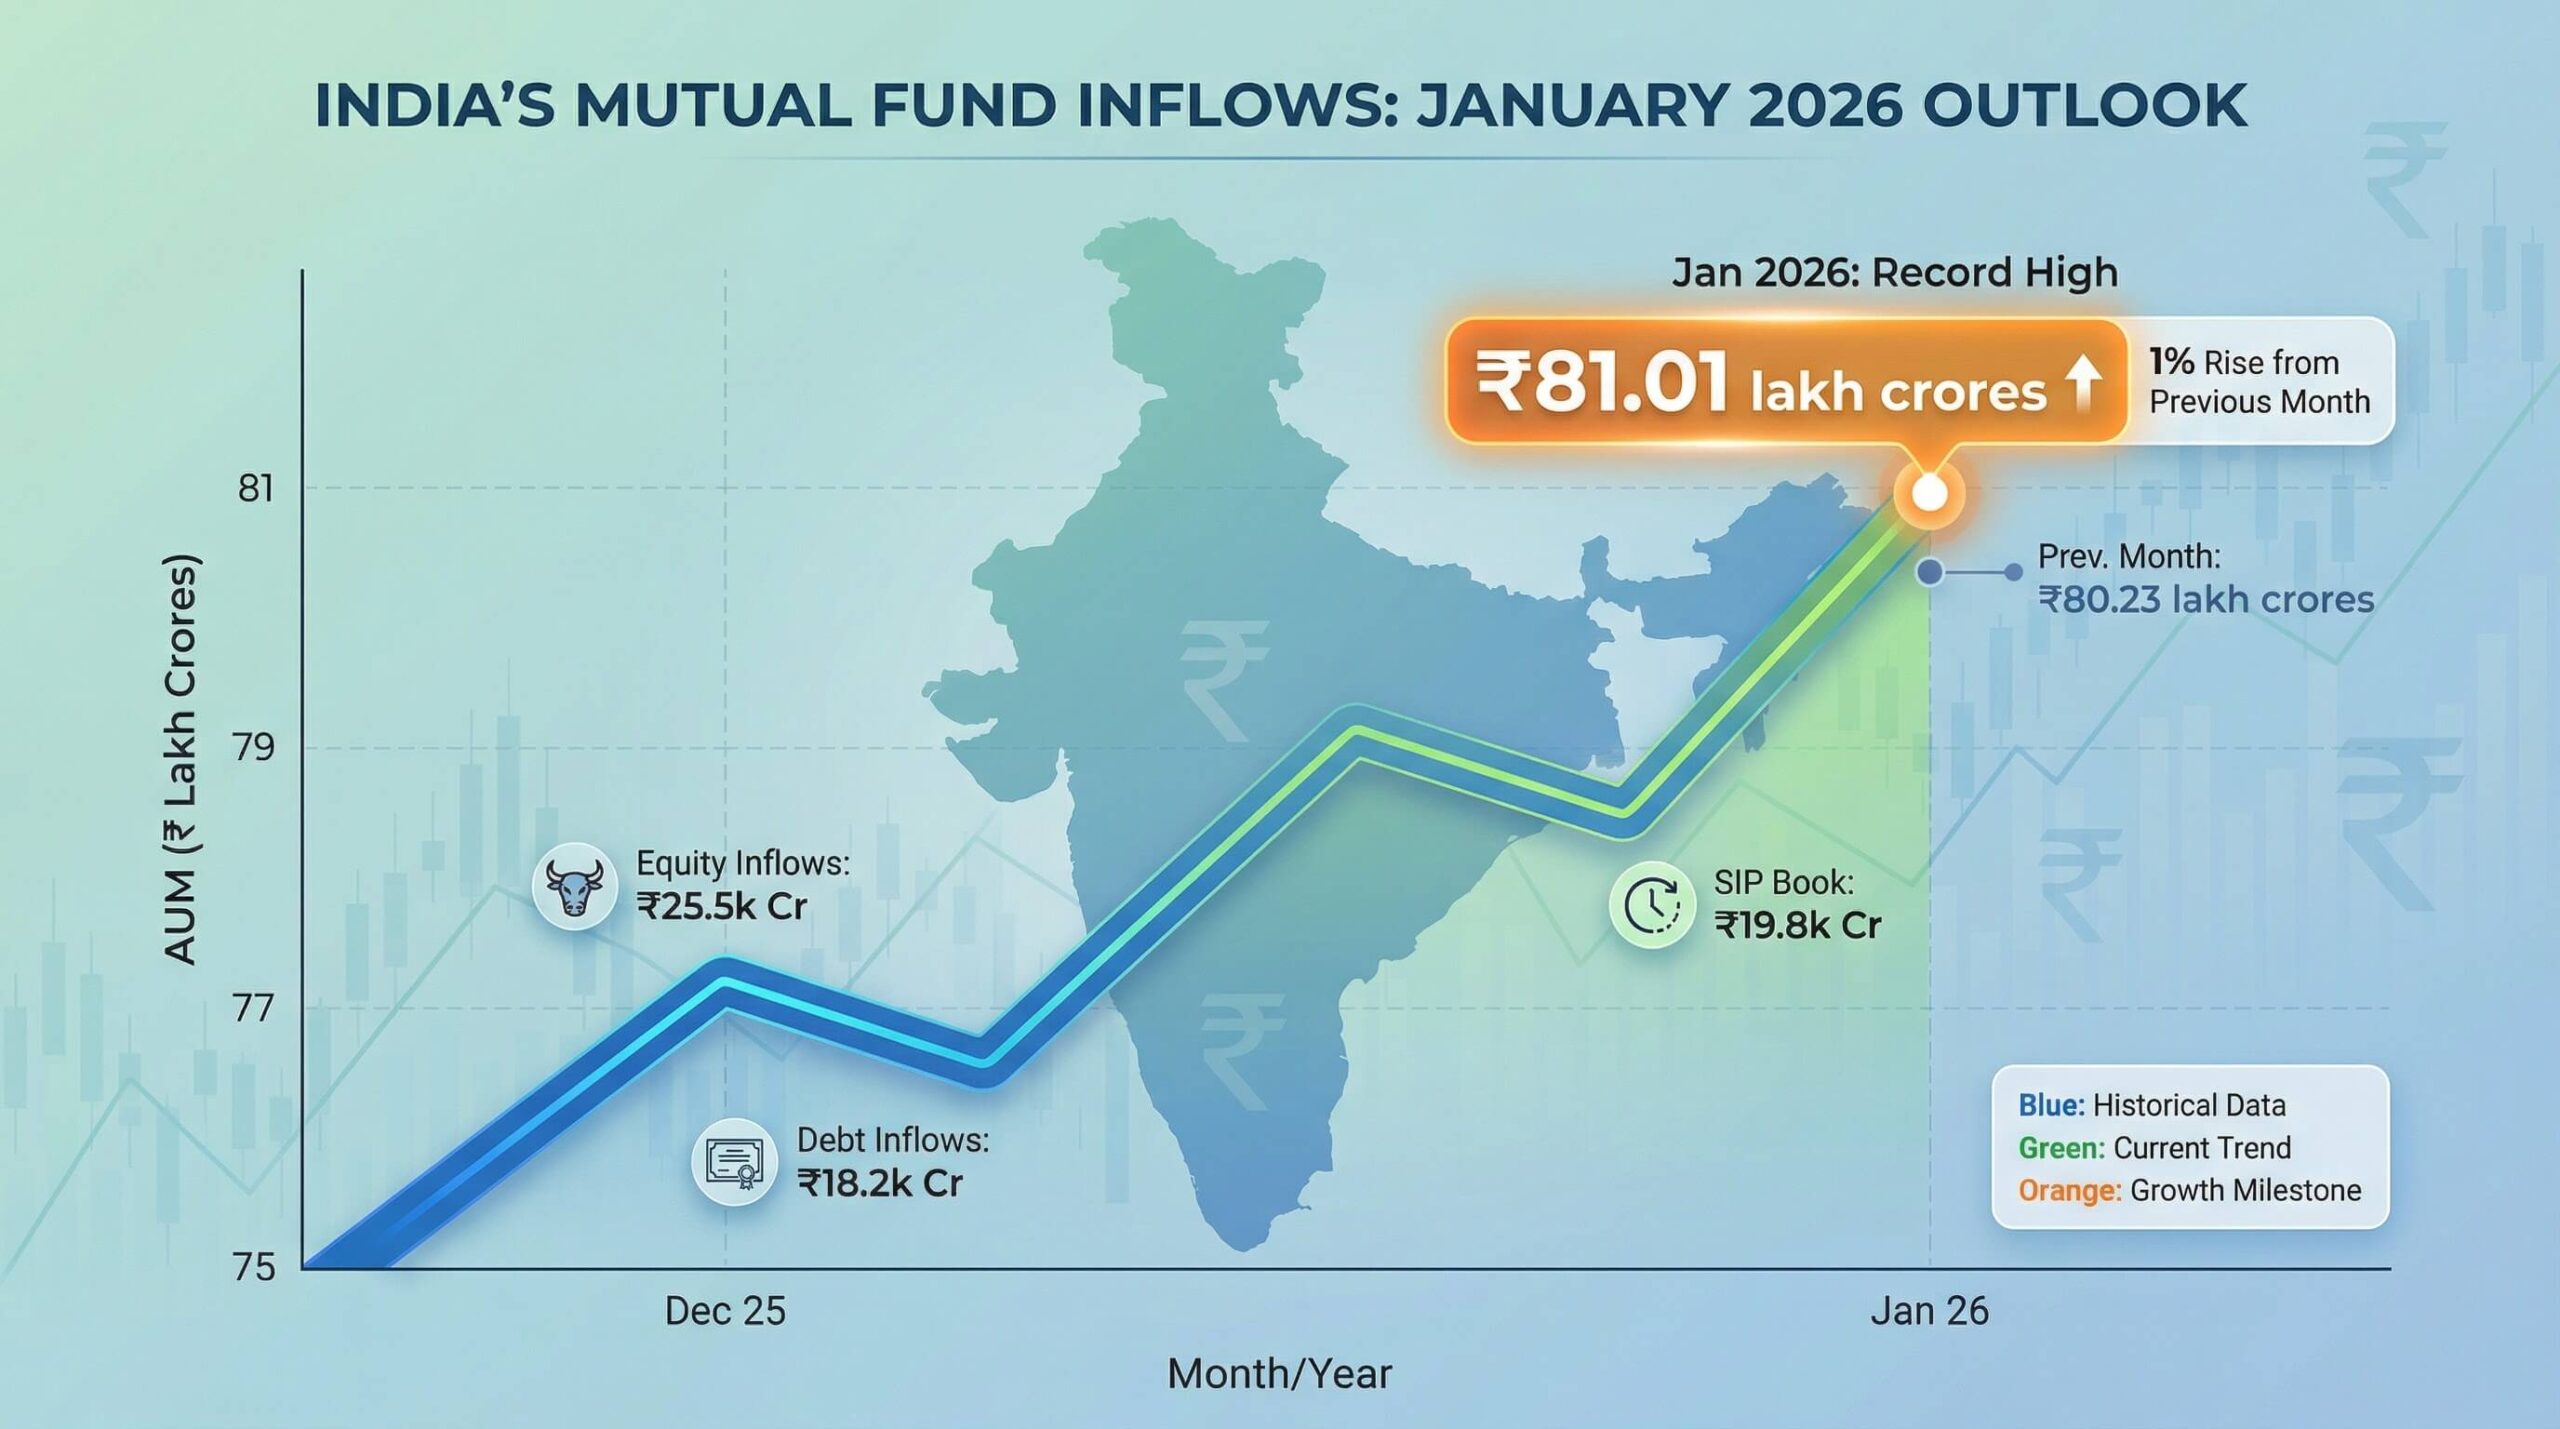
Indian mutual fund industry ended January 2026 with assets of Rs 81.01 lakh crs compared to  Rs 80.23 lakh crs in December 2025. The Industry witnessed net inflows of Rs 1.56 (-0.66)  lakh crs, with debt schemes showing inflows of Rs 0.74 (-1.32) lakh crs and equity and hybrid  schemes showing net positive inflows of Rs 24,028 (28,054) crs and Rs 17,356 (10,756) crs  respectively. Equity schemes saw a decrease in assets to Rs 34.87 (35.72) lakh crs. This was  mainly due to negative performance of the equity markets. Nifty 500 moved down by 3.27%  (+0.26%) and Nifty 50 also decreased by 3.04% (-0.28%) with mid caps down by 3.5%  (-0.53%) and small caps down by 5.5% (-0.28%). One year returns for all indices are slightly  positive except for small caps. Three and five year numbers continue to show healthy returns.

Mutual Fund Industry Overview

🔹 Monthly flow and AUM trends:

Equity Mutual Funds :

– Net flows in equity schemes decreased to Rs 24,028 crs from Rs 28,054 crs last month.  Though there have been no negative inflows for almost five years. Flows in NFOs were  subdued at Rs 806 (3,568) crs.

– Net inflows in various categories were as under and have mostly declined compared to last  month. ELSS funds saw net outflows:

– Sectoral/Thematic Funds: Rs 1,042 (946) crs

– Flexi-Cap Funds: Rs 7,672 (10,019) crs

– Small-Cap Funds: Rs 2,942 (3,824) crs

Mid-Cap Funds: Rs 3,185 (4,176) crs

The net inflows have dipped below the SIP inflows of Rs 30,000 crs showing that investors are  booking profits and moving out of equity funds.

📌 #EquityFunds #MutualFunds #WealthCreation #LongTermInvestment #EquityMarket #ELSSschemes #Equityschemes

Debt Funds: Inflows due to the beginning of the financial year/quarter

📉 Key Trends in Debt Funds:

Total debt fund AUM was Rs 18.09 (18.10) lakh crore, almost similar to last month. The  average assets in the month were higher suggesting a sell-off in the last few days of the month.

This category saw a net inflow of Rs 0.74 lakh crs compared to an outflow of 1.32 lakh crs last  month. Liquid, Money market and overnight saw inflows while corporate bond funds saw  outflows.

#DebtFunds #InterestRates #BondMarket #FixedIncome #FinancialPlanning

Hybrid & Passive Funds:

Hybrid funds’ assets were almost the same at Rs 11.0 lakh crs. Net inflows into hybrid funds  stood at Rs 17,356 (10,756) crs, led by Multi Asset Allocation funds, which saw inflows of Rs  10,485 (7,426) crs. Inflows in these funds have doubled in two months. Arbitrage funds  inflows also were at Rs 3,293 crs (126). Again investors are chasing returns with MAAF and  Gold ETFs seeing huge inflows.

📌 #HybridFunds #Diversification #RiskManagement #BalancedInvestment

Passive mutual funds:

Inflows into Gold ETFs have soared to 24,040 crs compared to 11,646 crs in December 2025.  Inflows in index funds were Rs 27.3 crs and those in other ETFs were Rs 15,005 crs (13,199).

Fund of Funds Schemes (FoFs):

FoFs collected almost Rs 11,250 (10,250) crs of net inflows. ng at sectoral or thematic funds  would be wise to choose from amongst these funds.

🧐 Way forward

Gold ETFs and Multi Asset Funds have seen an even higher increase in inflows in one month  due to the good performance of gold over the last 12 months. Investors are falling prey to the  FOMO phenomenon. Chasing returns is not the way to earn above average returns or beat the  benchmark. Asset allocation and re-balancing is the way to go. Say you have invested  60:25:15 in equities, debt and gold. Now gold has run up by 100% whereas debt is up 7% and  equities are flat. The portfolio will show a return of 16%. The portfolio value will be Rs 116  with an asset allocation of 51:23:26. If we re-balance the portfolio, we will sell gold and  invest the same in equity and debt and bring the asset allocation back to the original ratio. This  ensures that you sell the asset class which has increased in value and buy the other asset class  which is lower in your portfolio. Asset allocation ensure that you are present in all asset classes and reap the benefits of any sudden and great upturn in values and re-balancing  periodically ensures that you sell high and buy low. This simple discipline may go a long way  in getting above average returns.

About EquiZen

EquiZen, a registered mutual fund and PMS distributor, offering personalised financial  solutions with a focus on safety and transparency. We aim to assist you to achieve financial  freedom, the freedom to do what you want and achieve your dreams. We do not push financial  products but believe in utilising them judiciously to meet your needs. Learn more at  www.equizen.in or contact us via +91 9820605203 or sanjay@equizen.in.

India’s Mutual Fund Flows – Dec 2025: Total Mutual Fund assets fall by 0.7% to Rs 80.23 lakh crs

Inflows in Multi Asset Allocation Funds and Gold ETFs increase significantly compared to November 2025.

Indian mutual fund industry ended December 2025 with assets of Rs 80.23 lakh crs compared to Rs 80.8 lakh crs in November 2025.  The AUM of the industry has grown by 19.9% over the last twelve months.  The Industry witnessed net outflows of Rs 0.66 (+0.32) lakh crs, with debt schemes showing outflows of 1.32 lakh crs and equity and hybrid schemes showing net positive inflows of Rs 28,054 (29,911) crs and Rs 10,756 (13,299) crs respectively.  Equity schemes saw an increase in assets to Rs 35.72 (35.66) lakh crs.  This was mainly due to net inflows.  Nifty 500 moved down by 0.26% (+1%)  and Nifty 50 also decreased by 0.28% (1.92%) with mid caps down by 0.53% and small caps were down by 0.28%.  One year returns for all indices are slightly positive except for small caps.  Three and five year numbers continue to show healthy returns.

Mutual Fund Industry Overview

🔹 Monthly flow and AUM trends:

Equity Mutual Funds :

  • Net flows in equity schemes decreased slightly to Rs 28,054 crs from Rs 29,911 crs last month.  Though there have been no negative inflows for almost five years.  Flows have increased due to five new NFOs collecting Rs 3,568 (2,498) crs.
  • Net inflows in various categories were as under and have declined compared to last month.  ELSS and Dividend Yield funds saw net outflows:

– Sectoral/Thematic Funds: ₹ 946 (1,865) crs

– Flexi-Cap Funds: ₹ 10,019 (8,135) crs

– Small-Cap Funds: ₹ 3,824 (4,407) crs

  • Mid-Cap Funds: ₹ 4,176 (4,487) crs    

Monthly SIP inflows have grown 221% from Rs 13,306 crs in Nov 22 to Rs 31,002 crs in Dec 2025.  Net inflows have fallen below SIP inflows indicating that redemptions are more than lumps investments in equity schemes. 

📌 #EquityFunds #MutualFunds #WealthCreation #LongTermInvestment #EquityMarket #ELSSschemes #Equityschemes

Debt Funds: Inflows due to the beginning of the financial year/quarter

📉 Key Trends in Debt Funds:

Total debt fund AUM was ₹ 18.10 (19.36) lakh crore, a 6.5% decrease compared to last month and up by about 8.3% compared to last year.

This category saw a net outflow of Rs 1.32 lakh crs compared to an inflow of 0.25 lakh crs last month.  Liquid, Money market and short duration funds saw outflows while overnight funds were flat.

#DebtFunds #InterestRates #BondMarket #FixedIncome #FinancialPlanning

Hybrid & Passive Funds:

Hybrid funds’ assets increased to Rs 11.0 (10.88) lakh crs thus staying above the ten lakhs crore mark.  Net inflows into hybrid funds stood at Rs 10,756 (13,299) crs, led by Multi Asset Allocation funds, which saw inflows of Rs 7,426 (5,315) crs.  Conservative hybrid funds have seen poor inflows due to low returns.

📌 #HybridFunds #Diversification #RiskManagement #BalancedInvestment

Passive mutual funds:

AUM of passive funds rose 3.5% to 14.57 (14.02) lakh crs on the back of a surge in gold prices and rising inflows into these funds.  Index ETFs and Funds still form a huge chunk of these schemes.

Specialised Investment Schemes (SIFs):

SIF inflows were healthy in December and grew to Almost Rs 2,000 crs.  Distributors need to pass a derivatives exam to start selling these schemes.  Also, most of these schemes seem to be implementing arbitrage strategies and are not pure long short funds.   AUM of SIFs is Rs 4,832 crs.  As more and more AMCs, launch these schemes, the AUM will continuously grow over the next few months.  The performance of the equity schemes should be watched for a few months before taking an allocation to the same.

Fund of Funds Schemes (FoFs):

FoFs collected almost Rs 10,250 (5,000) crs of net inflows.  The taxation of FoFs has been brought in line with their underlying schemes and hence these category of schemes should be considered by each investor.  There are domestic and international FoFs, debt, thematic as well as hybrid and multiple asset FoFs.  Those who find it challenging to choose from thousands of schemes can choose a few FoFs which will ensure that they have a good asset allocation as well as a decent diversification within each asset class.  Those looking at sectoral or thematic funds would be wise to choose from amongst these funds.

🧐 Way forward

Gold ETFs and Multi Asset Funds have seen a sharp increase in inflows in one month due to the good performance of gold over the last 12 months.  Investors should start their investing journeys with Multi Asset, hybrid and domestic FoF schemes.  A combination of 3-4 such schemes should be adequate for most investors.    Investors should also not chase returns but stick to their asset allocations.  Given the already high increase in prices, future returns may not mimic past returns.

About EquiZen

EquiZen, a registered mutual fund and PMS distributor, offering personalised financial solutions with a focus on safety and transparency. We aim to assist you to achieve financial freedom, the freedom to do what you want and achieve your dreams.  We do not push financial products but believe in utilising them judiciously to meet your needs.  Learn more at www.equizen.in or contact us via +91 9820605203 or sanjay@equizen.in.

India’s Mutual Fund Flows – Nov 2025: Total Mutual Fund assets cross Rs 80 lakh crores

Indian mutual fund industry ended November 2025 with assets of Rs 80.8 lakh crores compared to Rs 79.9 lakh crores in October 2025.  The AUM of the industry has grown by 18% over the last twelve months.  The Industry witnessed net inflows of Rs 0.32 (2.15) lakh crores, with debt schemes showing outflows of 25,693 crs and equity and hybrid schemes showing net positive inflows of Rs 29,911 (24,690) crs and Rs 13,299 (14,156) crs respectively.  Equity schemes saw an increase in assets to Rs 35.66 (35.2) lakh crores.  This was mainly due to the positive performance of the markets as well as net inflows.  Nifty 500 moved up by 1% (4.37) % and Nifty 50 increased by 1.92% (4.62%) with mid caps up by 1.67% but small caps were down by 3.3%.  One year returns for all indices are slightly positive except for small caps.  Three and five year numbers continue to show healthy returns.

Mutual Fund Industry Overview

🔹 Monthly flow and AUM trends:

Equity Mutual Funds :

– Net flows in equity schemes increased slightly to Rs 29,911 crs from Rs 24,690 crs last month.  Though there have been no negative inflows for almost five years.  Flows have increased due to five new NFOs collecting Rs 2,498 crs.

– Net inflows in various categories were as under and have declined compared to last month.  ELSS and Dividend Yield funds saw net outflows:

– Sectoral/Thematic Funds: ₹ 1,865 (1,336) crores

– Flexi-Cap Funds: ₹ 8,135 (8,928) crores

– Small-Cap Funds: ₹ 4,407 (3,476) crores

– Mid-Cap Funds: ₹ 4,487 (3,807) crores    

Monthly SIP inflows have grown 221% from Rs 13,306 crs in Nov 22 to Rs 29,445 crs in Nov 2025.  While 57 lakh new SIPs were registered, 43.18 were discontinued or completed their tenure.  Overall, there are more than 10 crore SIPs in operation.  

📌 #EquityFunds #MutualFunds #WealthCreation #LongTermInvestment #EquityMarket #ELSSschemes #Equityschemes

Debt Funds: Inflows due to the beginning of the financial year/quarter

📉 Key Trends in Debt Funds:

Total debt fund AUM was ₹ 19.35 (19.51) lakh crore, a 0.8% decrease compared to last month and up by about 3.8% compared to last year.

This category saw a net outflow of Rs 0.25 lakh crs compared to an inflow of 1.6 lakh crs last month.  Liquid and overnight funds saw outflows while money market and low duration funds saw inflows.  Debt funds have been volatile over the last few months.

#DebtFunds #InterestRates #BondMarket #FixedIncome #FinancialPlanning

Hybrid & Passive Funds:

Hybrid funds’ assets increased to Rs 10.88 (10.70) lakh crs thus staying above the ten lakhs crore mark.  Net inflows into hybrid funds stood at Rs 13,299 (14,156) crores, led by Arbitrage and Multi Asset Allocation funds, which saw inflows of  ₹ 4,192 (6,930) and Rs 5,315 (5,3540 crores in November.  Conservative hybrid funds have seen poor inflows due to low returns.

📌 #HybridFunds #Diversification #RiskManagement #BalancedInvestment

Passive mutual funds:

AUM of passive funds rose 3.0% to 14.02 (13.67) lakh crores on the back of a surge in gold prices and rising inflows into these funds.

Specialised Investment Schemes (SIFs):

There are five SIFs in the market now with around 14,000 folios and AUM of Rs 3,000 crs.  There are two Equity SIFs and three hybrid SIFs.  More than 70% of the AUM is in the hybrid SIFs.

Fund of Funds Schemes (FoFs):

FoFs collected almost Rs 5,000 crs of net inflows.  The taxation of FoFs has been brought in line with their underlying schemes and hence these category of schemes should be considered by each investor.  There are domestic and international FoFs, debt, thematic as well as hybrid and multiple asset FoFs.  Those who find it challenging to choose from thousands of schemes can choose a few FoFs which will ensure that they have a good asset allocation as well as a decent diversification within each asset class.  Those looking at sectoral or thematic funds would be wise to choose from amongst these funds.

🧐 Way forward

Inflows in equity funds have been steady for the last four months mainly supported by good Sip inflows.  NFOs have retreated to the background and it is the new AMCs that will be coming out with new NFOs to complete their product baskets.  Older AMCs have also launched many sectoral and thematic schemes and each new schemes is unlikely to yield a significant addition to their over all assets.  Multi Asset funds flows will start declining once equity performance improves.  The next triggers for the markets could be the trade treaties and the budget.

About EquiZen

EquiZen, a registered mutual fund and PMS distributor, offering personalised financial solutions with a focus on safety and transparency. We aim to assist you to achieve financial freedom, the freedom to do what you want and achieve your dreams.  We do not push financial products but believe in utilising them judiciously to meet your needs.  Learn more at www.equizen.in or contact us via +91 9820605203 or sanjay@equizen.in.

India’s Mutual Fund Flows – Oct 2025: New SIFs garner more than Rs 2,000 crs

The first four schemes under the Specialised Investment Funds (SIFs) as allowed by SEBI were launched by different AMCs.  These SIFs make use of derivatives in a way which cannot not done by mutual fund schemes.  Hence the minimum investment amount in such schemes is Rs ten lakhs.  The first schemes under these category were launched by Asset Management Companies during October 2025 and garnered more than Rs 2,000 crs.

Indian mutual fund industry ended October 2025 with assets of Rs 79.9 lakh crores compared to Rs 75.61 lakh crores in September 2025.  The AUM of the industry has doubled over the last three years.  The Industry witnessed net inflows of Rs 2.15 (0.43) lakh crores, with debt schemes garnering 1,59,000 crs and equity and hybrid schemes showing net positive inflows of Rs 24,690 crs and Rs 14,156 crs respectively.  Equity schemes saw an increase in assets to Rs 35.2 (33.68) lakh crores.  This was mainly due to the positive performance of the markets as well as net inflows.  Nifty 500 moved up by 4.37% and Nifty 50 increased by 4.62% with mid and small caps also up.   One year returns for all indices are slightly positive.  Three and five year numbers continue to show healthy returns inspite of the near term blip.

Mutual Fund Industry Overview

🔹 Monthly flow and AUM trends:

Equity Mutual Funds :

– Net flows in equity schemes fell to Rs 24,690 crs from Rs 30,422 crs last month.  This has been the fourth consecutive month of decline in inflows.  Though there have been no negative inflows for almost five years.  Flows have declined inspite of six new NFOs collecting almost Rs 4,000 crs.  

– AUM of flexi cap funds is now almost the same as all thematic/sectoral funds.  This is a good thing as flexi cap funds should be less volatile then thematic funds.  Flexi cap funds had the highest inflows followed by mid and small cap funds.   SIP inflows were at Rs 29,529 (29,361) crs and were marginally higher than last month continuing the uptrend of the last few months.  

– Net inflows in various categories were as under and have declined compared to last month.  ELSS and Dividend Yield funds saw net outflows:  

Sectoral/Thematic Funds: 1,336 (1,221) crores

– Flexi-Cap Funds: 8,928 (7,029) crores  

– Small-Cap Funds: 3,476 (4,363) crores  

– Mid-Cap Funds: 3,807 (5,085) crores    

📌 #EquityFunds #MutualFunds #WealthCreation #LongTermInvestment #EquityMarket #ELSSschemes #Equityschemes

Debt Funds: Inflows due to the beginning of the financial year/quarter

📉 Key Trends in Debt Funds:

Total debt fund AUM was 19.51 (17.80) lakh crore, a 9.6% increase compared to last month and up by about 17.3% compared to last year.  

This category saw a net inflow of Rs 1.6 lakh crs compared to an outflow of 1.01 lakh crs last month.  Most debt fund categories saw net inflows highest inflows after liquid funds.   

#DebtFunds #InterestRates #BondMarket #FixedIncome #FinancialPlanning

Hybrid & Passive Funds:

Hybrid funds’ assets increased to Rs 10.70 (10.33) lakh crs thus staying above the ten lakhs crore mark.  A 22.6% increase over the last 12 months.  Net inflows into hybrid funds stood at Rs 14, 156 (9,397) crores, led by Arbitrage and Multi Asset Allocation funds, which saw inflows of  6,930 and Rs 5354 (4,982) crores in October.  Arbitrage funds saw inflows.  Given the volatility of the equity markets, multi asset funds should provide stable returns going forward till earning catch up with valuations.  Equity savings and balanced hybrid funds saw a decrease in inflows.  

📌 #HybridFunds #Diversification #RiskManagement #BalancedInvestment

Passive mutual funds:

AUM of passive funds rose 5.2% to 13.67 (12.99) lakh crores on the back of a surge in gold prices and rising inflows into these funds.  AUM of God ETFs crossed Rs 1 lakh crs and reached Rs 1.02 lakh crs.  Gold ETFs inflows were Rs 7,743 (8,363) crs.  Gold and silver have seen a big jump this year.

🧐 Way forward

Most indices have given a negative return over the last one year.  The markets have been volatile too.  Indian macros continue to be strong.  The recent cut in GST rates as well as the cuts in income tax at the beginning of the year should aid consumption.  The headwinds continue to be US tariffs as well as other policy related matters with other countries.  Investors are suggested to continue investing via SIPs and STPs.  Lumpsum investments in equities should be avoided.  Arbitrage and short term debt funds can be used to park funds and moved to large cap or hybrid schemes over the next 8-12 months.  The asset allocation to different asset classes should continue to be maintained. 

About EquiZen

EquiZen, a registered mutual fund and PMS distributor, offering personalised financial solutions with a focus on safety and transparency. We aim to assist you to achieve financial freedom, the freedom to do what you want and achieve your dreams.  We do not push financial products but believe in utilising them judiciously to meet your needs.  Learn more at www.equizen.in or contact us via +91 9820605203 or sanjay@equizen.in.

India’s Mutual Fund Flows – August 2025: Total assets fall due to market movements. However, inflows are still positive

The Indian mutual fund industry ended August 2025 with assets of Rs 75.19 lakh crores compared to Rs 75.35 lakh crores in July 2025.  The Industry witnessed net inflows of Rs 0.52 lakh crores, with debt schemes experiencing outflows of 8,000 crs and equity and hybrid schemes showing net positive inflows of Rs 33,430 crs and Rs 15,294 crs respectively.  Equity schemes saw a decrease in assets to Rs 33.1 lakh crores.  This was mainly due to the negative performance of the markets.  Nifty 500 fell by 1.82% which followed a 2.83% dip in July 2025 and Nifty 50 fell by 1.21% with mid and small caps also in the red.   One year returns for all indices are negative.  Three and five year numbers continue to show healthy returns inspite of the near term blip.

Mutual Fund Industry Overview

🔹 Monthly flow and AUM trends:

Equity Mutual Funds :

– Net flows in equity schemes fell to Rs 33,430 crs from Rs 42,702 crs.  This was mainly due to only two thematic NFOs in the month.  Flows into large cap funds increased and those into small cap funds decreased.  This is a good sign since small and mid caps are trading at levels higher than their average levels.  SIP inflows were at Rs 28, 265 crs and though they were marginally lower than last month, the number is still a good one.

– Net inflows in various categories were as under and have declined compared to last month:

– Sectoral/Thematic Funds: ₹ 3,893 (9,426) crores

– Flexi-Cap Funds: ₹ 7,679 (7,654) crores

– Small-Cap Funds: ₹ 4,993 (6,484) crores

– Mid-Cap Funds: ₹ 5,331 (5,182) crores  

There were two thematic fund New Fund Offers (NFOs) in August which collected Rs 1,422 crs.

📌 #EquityFunds #MutualFunds #WealthCreation #LongTermInvestment #EquityMarket #ELSSschemes #Equityschemes

Debt Funds: Inflows due to the beginning of the financial year/quarter

📉 Key Trends in Debt Funds:

Total debt fund AUM was ₹18.71 (18.75) lakh crore, a 0.2% decrease compared to last month but up by about 17% compared to last year.

Liquid Fund and Corporate Bond funds saw net outflows.  There was also a dip in the net inflows into Money Market funds.  These are the three largest debt fund categories.  Overnight funds saw also saw positive inflows though almost half of the previous month.  Due to increase in yields of 10 year G-secs, we might be seeing a flight to the safety of overnight funds.  September is also to see monies flowing out of debt funds due to advance tax payments, tax return filing dates as well as it being the quarter end.

#DebtFunds #InterestRates #BondMarket #FixedIncome #FinancialPlanning

Hybrid & Passive Funds:

Hybrid funds’ assets increased to Rs 10.08 (10.03) lakh crs thus staying above the ten lakhs crore mark.  A 17% increase over the last 12 months.  Net inflows into hybrid funds stood at Rs 15,294 (20,879) crores, led by Arbitrage funds, which saw inflows of  ₹ 6,667 (7,296) crores in August.  Multi Asset funds saw a dip.  These are the best funds to invest in at the moment.

📊 Hybrid Funds Inflows Breakdown:

– Multi-Asset Allocation Funds: ₹ 3,528 (6,197) crore

– Dynamic Asset Allocation/Balanced Advantage Funds: ₹ 2,316 (2,611) crore

📌 #HybridFunds #Diversification #RiskManagement #BalancedInvestment

🧐 Way forward

Most indices have given a negative return over the last one year.  The markets have been volatile too.  Indian macros continue to be strong.  The recent cut in GST rates as well as the cuts in income tax at the beginning of the year should aid consumption.  The headwinds continue to be US tariffs as well as other policy related matters with other countries.  Investors are suggested to continue investing via SIPs and STPs.  Lumpsum investments in equities should be avoided.  Arbitrage and short term debt funds can be used to park funds and moved to large cap or hybrid schemes over the next 8-12 months.  The asset allocation to different asset classes should continue to be maintained. 

About EquiZen

EquiZen, a registered mutual fund and PMS distributor, offering personalised financial solutions with a focus on safety and transparency. We aim to assist you to achieve financial freedom, the freedom to do what you want and achieve your dreams.  We do not push financial products but believe in utilising them judiciously to meet your needs.  Learn more at www.equizen.in or contact us via +91 9820605203 or sanjay@equizen.in.

India’s Mutual Fund Flows – June 2025: Total assets cross Rs 74 lakh crores based on equity market gains

The Indian mutual fund industry ended June 2025 with assets of Rs 74 lakh crores.  The Industry witnessed net inflows of Rs 0.49 lakh crores, with equity and hybrid schemes showing net positive inflows while debt schemes saw outflows.  Equity schemes saw an increase in assets to Rs 33.47 lakh crores.  Of this total increase in assets, the schemes saw a net inflow of Rs 23,587 crs and the rest was contributed by the rise in equity markets.  Nifty 500 rose by 3.77% and Nifty 50 rose by 3.37% with mid and small caps turning in good performances.  FII and DIIs invested consistently compared to the last month probably leading to the better returns.  

As we write this, tariff issues have again come to the forefront while the Israel-Iran confrontation has come to a halt.  Accordingly, markets may be driven by Q1 FY 26 results as well as other macro factors.

Mutual Fund Industry Overview

🔹 Total AUM & Net Inflows:

– The mutual fund industry’s total AUM stood at 74 lakh crore, reflecting an 21.7% YoY increase and a 3.1% increase over May 2025.  

– The monthly inflows were muted across all categories of schemes.  Inflows in debt schemes were negative and those in equity schemes were Rs 23,587 crores led by a reduction in redemptions.  This led to an increase in net flows in the month but the Flows were 40,000 crs in December 2024.

🔹 Monthly flow and AUM trends:

Equity Mutual Funds :

– Net flows saw an uptick in June mainly driven by lower redemptions.  Gross inflows were the same as last month.  SIPs have been increasing hence lumps investments may have slowed down.  Flows have fallen to Rs 23,587 crs from Rs 41,156 crs in December 2024.  The industry saw high inflows in the months of May 2024 to January 2025.  This is when the markets were showing good returns.  Now one year returns have come down to single digits and inflows have come down to half of what they were in that period.  

– SIP accounts increased in June to 8.64 crs from 8.56 crs.  SIP flows rose in June 2025 to 27,269 crs.  This is a good sign.  SIP account have increased over the last three months after falling in February and March.  Gross inflows in equity funds was Rs 56,944 crs and redemptions were Rs 36,357 crs.  The Gross inflows have fallen from 71,000 crs in May 2025.  So the industry is seeing a drop in inflows along with an increase in outflows leading to reduction in net inflows.  Investors should continue investing in markets through SIPs.  If they have lumpsum amounts to invest, they can park the same in debt or arbitrage funds and do an STP into equity funds to lower their average cost of purchase.  Since interest rates are now lower compared to a year ago, equity remains the best bet to earn higher returns over the next 3-5 years.  Investors should not expect positive double digit returns in every year.  The best times to invest are the periods where the returns in the past are low.    

– Sectoral funds saw the maximum inflows and outflows amongst equity schemes.  The next highest inflows were in flexi cap funds followed by mid cap and small cap funds.  Net inflows in various categories were as under and have declined compared to last month:  

Sectoral/Thematic Funds: 475.61 (2,052) crores

– Flexi-Cap Funds: 5,733 (3,841) crores  

– Small-Cap Funds: 4,024 (3,214) crore  

– Mid-Cap Funds: 3,754 (2,808) crore  

There was two thematic fund NFOs in June which collected Rs 667 crs.   Flexi cap funds showed the highest net inflows in June followed by small and mid cap funds.  Investors should ensure that their exposure to mid and small caps are in accordance with their risk profiles.  Total exposure to these schemes should range from 25-50% of the total investment in equities.  Exposure to thematic funds should not be more than 15% of their total equity portfolio.  

 📌 #EquityFunds #MutualFunds #WealthCreation #LongTermInvestment #EquityMarket #ELSSschemes #Equityschemes

Debt Funds: Inflows due to the beginning of the financial year/quarter

📉 Key Trends in Debt Funds:

Total debt fund AUM was 17.58 (17.54) lakh crore, a 0.2% increase compared to last month  but up by about 21% compared to last year.  

The Industry saw outflows from liquid and overnight funds which were compensated by inflows in money market, short duration and corporate bond funds.  One can see the trend of money into higher yield category funds due to a decrease in interest rates.  

#DebtFunds #InterestRates #BondMarket #FixedIncome #FinancialPlanning

Hybrid & Passive Funds:

Hybrid funds’ assets increased to Rs 9.92 (9.55) lakh crs.  A 22% increase over the last 12 months.  Net inflows into hybrid funds stood at Rs 23,223 (20,765) crores, led by Arbitrage funds, which saw inflows of  15,585 (15,702) crores in May.  These again shows profit booking in equity schemes or parking of funds waiting for a dip in markets to enter again.

📊 Hybrid Funds Inflows Breakdown:

– Multi-Asset Allocation Funds: 3,210 (2,927) crore  

– Dynamic Asset Allocation/Balanced Advantage Funds: 1,886 (1,136) crore  

📌 #HybridFunds #Diversification #RiskManagement #BalancedInvestment

🧐 Why the Shift to Multi Asset Funds?

– Multi-asset allocation funds and balanced advantage funds are seeing increasing inflows.  This is a good sign and these funds are inherently diversified.  Multi asset funds have exposure to three asset classes whereas balanced advantage funds invest in equity and debt on a dynamic basis.     

📌 #MutualFundIndia #InvestWisely #GrowYourMoney #PersonalFinance #IndiaMarkets #InvestmentGoals

Way forward 

Markets are expected to be volatile given the increase in geo-political issues in the middle east as well as tariffs on trade.  Investors with a long term horizon can take exposure to equities via SIPs or STPs.  Those looking at fixed income should consider corporate bond funds.

About EquiZen

EquiZen, a registered mutual fund and PMS distributor, offers personalised financial solutions with a focus on safety and transparency. We aim to assist you to achieve financial freedom, the freedom to do what you want and achieve your dreams.  We do not push financial products but believe utilising them judiciously to meet your needs.  Learn more at www.equizen.in or contact us via +91 9820605203 or sanjay@equizen.in.

India’s Mutual Fund Flows – May 2025: Total assets cross Rs 70 lakh crores based on equity market gains

The Indian mutual fund industry ended May 2025 with assets of Rs 72.2 lakh crores.  The Industry witnessed net inflows of Rs 0.29 lakh crores, with equity and hybrid schemes showing net positive inflows while debt schemes saw outflows.  Equity schemes saw an increase in assets to Rs 32.05 lakh crores.  Of this total increase in assets, the schemes saw a net inflow of Rs 19,013 crs and the rest was contributed by the rise in equity markets.  Nifty 500 rose by 3.65% and Nifty 50 rose by 1.92% with mid and small caps turning in good performances.  FII and DIIs invested more funds compared to the last month probably leading to the better returns.  

As we write this, geo-political issues in the middle east have escalated, accordingly, it is possible that markets may not do well in June.  The impact will be felt on the assets not only in terms of inflows but also in terms of market action.

Mutual Fund Industry Overview

🔹 Total AUM & Net Inflows:

– The mutual fund industry’s total AUM stood at 72.2 lakh crore, reflecting an 22.5% YoY increase and a 3.1% increase over April 2025.  

– The monthly inflows were muted across all categories of schemes.  Inflows in debt schemes were negative and those in equity schemes fell below Rs 20,000 crores for the first time in many months.  Equity flows have been trending lower for the past five months.  The Flows were 40,000 crs in December 2024.

🔹 Monthly flow and AUM trends:

Equity Mutual Funds :

– This is the fifth consecutive month that saw net inflows into equity schemes seeing a decline.  Flows have fallen to Rs 19,013 crs from Rs 41,156 crs in December 2024.  The industry saw high inflows in the months of May 2024 to January 2025.  This is when the markets were showing good returns.  Now one year returns have come down to single digits and inflows have come down to half of what they were in that period.  

– SIP accounts increased in May to 8.56 crs from 8.38 crs.  SIP flows rose in May 2025 to 26,688 crs.  This is a good sign.  SIP account have increased over the last two months after falling in February and March.  Gross inflows in equity funds was Rs 56,604 crs and redemptions were Rs 37,591 crs.  The Gross inflows have fallen from 71,000 crs in May 2025.  So the industry is seeing a drop in inflows along with an increase in outflows leading to reduction in net inflows.  Investors should continue investing in markets through SIPs.  If they have lumpsum amounts to invest, they can park the same in debt or arbitrage funds and do an STP into equity funds to lower their average cost of purchase.  Since interest rates are now lower compared to a year ago, equity remains the best bet to earn higher returns over the next 3-5 years.    

– Sectoral funds saw the maximum inflows and outflows amongst equity schemes.  The next highest inflows were in flexi cap funds followed by mid cap and small cap funds.  Net inflows in various categories were as under and have declined compared to last month:  

Sectoral/Thematic Funds: 2,052 (2,000) crore

– Flexi-Cap Funds: 3,841 (5,542) crore  

– Small-Cap Funds: 3,214 (4,000) crore  

– Mid-Cap Funds: 2,808 (3,314) crore  

There was two thematic fund NFOs in May which collected Rs 1792 crs.   Flexi cap funds showed the highest net inflows in May.  Investors should ensure that their exposure to mid and small caps are in accordance with their risk profiles.  Total exposure to these schemes should range from 25-50% of the total investment in equities.  Exposure to thematic funds should not be more than 15% of their total equity portfolio.  

 📌 #EquityFunds #MutualFunds #WealthCreation #LongTermInvestment #EquityMarket #ELSSschemes #Equityschemes

Debt Funds: Inflows due to the beginning of the financial year/quarter

📉 Key Trends in Debt Funds:

Total debt fund AUM was 17.54 (17.57) lakh crore, a 0.16% decline compared to last month  but up by about 16% compared to last year.  

The Industry saw outflows from liquid and overnight funds and inflows in money market and corporate bond funds.  One can see the trend of money into higher yield category funds due to a decrease in interest rates.  

#DebtFunds #InterestRates #BondMarket #FixedIncome #FinancialPlanning

Hybrid & Passive Funds:

Hybrid funds’ assets increased to Rs 9.55 (9.14) lakh crs.  A 22% increase over the last 12 months.  Net inflows into hybrid funds stood at Rs 20,765 (14,248) crores, led by Arbitrage funds, which saw inflows of  15,702 (11,790) crores in May.  These again shows profit booking in equity schemes or parking of funds waiting for a dip in markets to enter them again.

📊 Hybrid Funds Inflows Breakdown:

– Multi-Asset Allocation Funds: 2,927 (2,106) crore  

– Dynamic Asset Allocation/Balanced Advantage Funds: 1,136 (881) crore  

📌 #HybridFunds #Diversification #RiskManagement #BalancedInvestment

🧐 Why the Shift to Multi Asset Funds?

– Multi-asset allocation funds and balanced advantage funds are seeing increasing inflws.  This is a good sign and these funds are inherently diversified.  Multi asset funds have exposure to three asset classes whereas balanced advantage funds invest in equity and debt on a dynamic basis.     

📌 #MutualFundIndia #InvestWisely #GrowYourMoney #PersonalFinance #IndiaMarkets #InvestmentGoals

Way forward 

Markets are expected to be volatile given the increase in geo-political issues in the middle east as well as tariffs on trade.  Investors with a long term horizon can take exposure to equities via SIPs or STPs.  Those looking at fixed income should consider corporate bond funds.

About EquiZen

EquiZen, a registered mutual fund and PMS distributor, offers personalised financial solutions with a focus on safety and transparency. We aim to assist you to achieve financial freedom, the freedom to do what you want and achieve your dreams.  We do not push financial products but believe utilising them judiciously to meet your needs.  Learn more at www.equizen.in or contact us via +91 9820605203 or sanjay@equizen.in.

April 2025 Mutual Fund Analysis: Equity, Debt, and Hybrid Trends

India’s Mutual Fund Flows – April 2025: Debt flows and rise in equity markets propel AUM to new highs

The Indian mutual fund industry ended April 2025 with assets of Rs 69.99 lakh crores.  The Industry witnessed net inflows of Rs 2.77 lakh crores, of which 80% were in debt schemes.  Equity schemes saw an increase in assets of Rs 1.12 lakh crs taking the total assets to Rs 30.6 lakh crores.  Of this total increase in assets, the schemes saw a net inflow of Rs 24,249 crs and the rest was contributed by the rise in equity markets.  Nifty 500 rose by 3.25% and Nifty 50 rose by 3.48%.  FII flows were positive in the month compared to last three months when they were negative.  DII inflows were positive though at the lowest levels in the last three months. 

Mutual Fund Industry Overview – April 2025

Specialised Investment Funds (SIFs) are investment vehicles in India that are regulated by the Securities and Exchange Board of India (SEBI). These funds pool capital from accredited investors and HNIs with the primary objective of investing in specific, often non-traditional, asset classes or employing sophisticated investment strategies. 

A key differentiator for SIFs compared to traditional mutual funds is the enhanced flexibility afforded to fund managers, including the ability to engage in strategies such as short selling, where they can bet against the price of a stock, up to a limit of 25% of their net portfolio using derivatives. This feature provides a tool for potentially generating returns in both upward and downward trending markets, leading to more dynamic investment strategies. 

Despite this increased freedom in investment strategy, SIFs operate within a regulated environment overseen by SEBI. They are designed to bridge the gap between conventional mutual funds, which typically have broader investment mandates and often lower minimum investment amounts, and AlFs), which come with higher investment thresholds.

Key Features and Benefits of SIFs for HNIs

🔹 Total AUM & Net Inflows:

– The mutual fund industry’s total AUM stood at 69.99 lakh crore, reflecting an 22.2% YoY increase and a 6.5% increase over March 2025.  

– The monthly inflows were hugely positive due to debt schemes.  Inflows in debt schemes were mainly in liquid, money market, ultra short duration and overnight schemes.  

🔹 Monthly flow and AUM trends:

Equity Mutual Funds :

– This is the fifth consecutive month that saw net inflows into equity schemes seeing a decline.  Flows have fallen to Rs 24,269 crs from Rs 41,156 crs in December 2024.  

– SIP flows rose in April 2025 to 26,632 crs.  This is the highest inflow in the last six months.  Since the net inflow into equity mutual funds was lower than this number, it means that lumps inflows were negative.  Investors withdrew Rs 32,478 crs from equity mutual fund schemes.   

– Net flows in equity mutual funds are lower than SIP flows which show that lumpsum investments have dried up.  One year returns are now in single digits and three month returns are negative.  Investors should stop looking at past returns to determine the timing of their investments.  This is the time when SIPs will average out the cost of units and give higher returns when markets go up in the future.  Hope investors not only not stop their SIPs but also not redeem their investments and stay invested.  Returns are compounded over long periods of time.  

Sectoral/Thematic Funds: 2001 crore

– Flexi-Cap Funds: 5,542 crore  

– Small-Cap Funds: 4,000 crore  

– Mid-Cap Funds: 3,314 crore  

Thematic funds have shown a big dip in flows compared to a few months ago.  They were 15,000 crs in Dec 2024.  There was one NFO in April which collected Rs 170 crs.   Flexi cap funds showed the highest net inflows in April followed by small and madcap funds.  Investors should ensure that their exposure to mid and small caps are in accordance with their risk profiles.  Total exposure to these schemes should range from 25-50% of the total investment in equities.  

 📌 #EquityFunds #MutualFunds #WealthCreation #LongTermInvestment #EquityMarket #ELSSschemes #Equityschemes

Debt Funds: Inflows due to the beginning of the financial year/quarter

📉 Key Trends in Debt Funds:

Total debt fund AUM was 17.57 lakh crore, a 15.0% increase compared to last month and also up by about 20% compared to last year as well as up by 30% over three years.  

– Liquid funds again became the largest AUM category in the industry with assets of Rs 5.59 lakh crores.   They saw inflows of 1.18 lakh crs.  

– Money market funds have the second highest assets at 2.66 lakh crs and have seen a 44% growth over 12 months.  These are great for investments upto 12 months.  

 📌 #DebtFunds #InterestRates #BondMarket #FixedIncome #FinancialPlanning

Hybrid & Passive Funds:

Hybrid funds’ assets increased to Rs 9.14 lakh crs.  A 20% increase over the last 12 months.  Net inflows into hybrid funds stood at 14,248 crores, led by Arbitrage funds, which saw inflows of  11,790 crores in April.  In March, these funds saw an outflow of Rs 2,855 crs.  Investors may have booked profits in equity schemes.    Dynamic asset allocation schemes have the highest assets at Rs 2,92,550 crs.  However, Arbitrage schemes may soon become the largest category in terms of assets.

📊 Hybrid Funds Inflows Breakdown:

– Multi-Asset Allocation Funds: 2,106 crore  

– Dynamic Asset Allocation/Balanced Advantage Funds: 881 crore  

📌 #HybridFunds #Diversification #RiskManagement #BalancedInvestment  

🧐 Why the Shift to Multi Asset Funds?

– Multi-asset allocation funds provide diversification, making them a preferred choice in uncertain market conditions.  These funds are the fastest growing category of hybrid funds providing investors with double digit returns with low volatility.  They continue their consistent inflows in April too.    

📌 #MutualFundIndia #InvestWisely #GrowYourMoney #PersonalFinance #IndiaMarkets #InvestmentGoals

About EquiZen

EquiZen, a registered mutual fund and PMS distributor, offers personalised financial solutions with a focus on safety and transparency. We aim to assist you to achieve financial freedom, the freedom to do what you want and achieve your dreams.  We do not push financial products but believe utilising them judiciously to meet your needs.  Learn more at www.equizen.in or contact us via +91 9820605203 or sanjay@equizen.in.

Specialised Investment Funds (SIFs): A Guide for Indian HNIs

Specialised Investment Funds (SIFs) represent a significant evolution in the Indian financial landscape, offering a novel investment avenue tailored to the needs of High Net-worth Individuals (HNIs). These funds are designed to provide access to sophisticated investment opportunities that go beyond the scope of traditional mutual funds, potentially offering enhanced returns alongside increased risk. 

For HNIs seeking to diversify their portfolios and explore niche markets with potentially lower minimum investment thresholds compared to Alternative Investment Funds (AIFs), SIFs present a compelling option.

What are Specialised Investment Funds (SIFs)?

Specialised Investment Funds (SIFs) are investment vehicles in India that are regulated by the Securities and Exchange Board of India (SEBI). These funds pool capital from accredited investors and HNIs with the primary objective of investing in specific, often non-traditional, asset classes or employing sophisticated investment strategies. 

A key differentiator for SIFs compared to traditional mutual funds is the enhanced flexibility afforded to fund managers, including the ability to engage in strategies such as short selling, where they can bet against the price of a stock, up to a limit of 25% of their net portfolio using derivatives. This feature provides a tool for potentially generating returns in both upward and downward trending markets, leading to more dynamic investment strategies. 

Despite this increased freedom in investment strategy, SIFs operate within a regulated environment overseen by SEBI. They are designed to bridge the gap between conventional mutual funds, which typically have broader investment mandates and often lower minimum investment amounts, and AlFs), which come with higher investment thresholds.

Key Features and Benefits of SIFs for HNIs

SIFs will invest in equities, debt, commodities, REITs & INVITs and derivatives related to these instruments. However, these schemes can go short in equity and debt derivatives only. 

SIFs offer sophisticated and customized investment strategies, including the flexibility to structure themselves as open-ended, close-ended, or interval funds, and to employ diverse approaches like long-short equity, debt, and hybrid strategies, thereby catering to a wide spectrum of risk appetites and investment objectives. 

Due to the ability to utilize more active and potentially higher-risk strategies, SIFs hold the potential for better returns compared to more conventional investment options. 

The regulatory framework governing SIFs also allows for greater flexibility in pursuing niche investments. HNIs benefit from the expertise of experienced fund managers who are equipped to navigate the complexities of these specialized strategies and markets.

SIFs vs. Traditional Investment Options

To better understand the positioning and characteristics of Specialised Investment Funds, it is helpful to compare them with traditional investment options commonly available in India. The following table highlights key differences across several important parameters:

Feature  Specialised 

Investment Funds (SIFs)

Traditional 

Mutual Funds

Alternative 

Investment Funds 

(AIFs)

Minimum 

Investment

₹10 lakh ₹500 onwards ₹1 crore
Regulatory 

Oversight 

Investment 

Strategies

SEBI

Flexible, including

long-short

SEBI

Generally

broader, less

niche

SEBI

Flexible including

long-short

Flexibility  High Moderate Very High
Liquidity  Moderate High Low
Risk Level  Higher Moderate to High High to Very High
Potential 

Returns

Higher Moderate to High High to Very High
Target 

Audience

HNIs, Sophisticated Investors Retail, HNIs HNIs, Institutions
Ability to 

Short Sell

Allowed (up to 25%) Generally Not

Allowed

Allowed

This comparison illustrates that SIFs occupy a unique space in the investment landscape. They offer more strategic flexibility than traditional mutual funds, including the ability to employ strategies like short selling, while having a lower minimum investment threshold than most PMS offerings.

Although regulated by SEBI like both mutual funds and AIFs, the specific regulations for SIFs are tailored to their specialized nature. The risk and potential return profiles of SIFs are generally higher than those of traditional mutual funds but might be comparable to some AIF strategies, depending on their focus.

Understanding the Core Investment Strategies of SIFs

The regulatory framework for Specialised Investment Funds permits three distinct core investment strategy categories: Equity-Oriented, Debt-Oriented, and Hybrid Strategies.

Equity-Oriented Strategies

Equity-Oriented Strategies primarily focus on investing in equity and related instruments. Examples of fund types within this category include Equity Long-Short Funds, which take both long (buy) and short (sell) positions in equity stocks, Equity ExTop 100 Long-Short Funds, which

might focus on stocks outside the top 100 by market capitalization while employing long-short strategies, and Sector Rotation Long-Short Funds, which dynamically adjust their long and short positions across different sectors based on market outlook. Notably, equity-oriented SIFs are mandated to invest at least 80% of their net assets in equity and related instruments. 

Debt-Oriented Strategies 

Debt-Oriented Strategies, on the other hand, concentrate their investments predominantly in debt instruments. Examples in this category include Debt Long-Short Funds, which might take long and short positions in various debt securities, and Sectoral Debt Long-Short Funds, which focus on specific sectors within the debt market. 

Hybrid Strategies 

Hybrid Strategies involve a combination of both equity and debt instruments within the portfolio. Examples here include Active Asset Allocator Long-Short Funds, which dynamically manage the allocation between equity and debt while potentially using long-short strategies in either or both asset classes, and Hybrid Long-Short Funds, which maintain a more static mix of equity and debt while employing long-short techniques. 

It is important to note that the current regulations permit only one investment strategy under each of these three categories per SIF, which is likely intended to ensure a focused investment approach within each specialized fund. 

This categorization of SIF strategies provides a clear framework for HNIs to understand the investment focus and potential risk-return characteristics of different SIF offerings. This classification aligns with the familiar categorization used for traditional mutual funds, which can aid investors in navigating the SIF landscape.

The Power of Long-Short Strategies

A significant aspect of Specialised Investment Funds, and one that holds particular appeal for sophisticated investors, is the ability to employ long-short investment strategies. At its core, a long-short strategy involves simultaneously investing in companies that are considered fundamentally strong and likely to appreciate in value (taking a ‘long’ position) while also betting against companies that are perceived as overvalued or fundamentally weak or facing headwinds and expected to decline in price (taking a ‘short’ position). 

One of the potential benefits of this strategy is its ability to provide a degree of downside protection during market downturns, as the short positions can potentially offset losses from the long positions. Additionally, it offers the possibility of generating returns in both rising and falling markets, as profits can be made from both the appreciation of long positions and the depreciation of short positions. 

However, it is crucial to acknowledge the challenges and considerations associated with effectively executing a long-short strategy. It requires a high degree of skill and expertise in

identifying both promising long candidates and suitable short candidates. Furthermore, this strategy can be particularly difficult to implement successfully in strongly trending markets, whether they are consistently bullish or bearish. 

Data from global hedge funds, which pioneered long-short strategies, indicates that they have not always outperformed broader market indices, highlighting the complexities involved. The success of a long-short strategy is heavily reliant on the fund manager’s ability to make accurate assessments and time the market effectively. 

HNIs must recognize that this approach is not a guaranteed path to higher returns and necessitates careful selection of fund managers with a proven track record in this specialized area. The inclusion of long-short strategies within the SIF framework provides HNIs with access to an investment tool that has historically been associated with more exclusive investment vehicles like hedge funds, now available within the regulated structure of Indian mutual funds.

Benchmarking and Performance Evaluation of SIFs

According to the regulations, each SIF investment strategy will follow a single-tier benchmark, which serves as the primary reference point for evaluating its performance. 

Additionally, there is an option to include a second-tier benchmark, which could potentially offer a more granular comparison against a specific market segment or a peer group of similar strategies. 

For equity-oriented strategies, benchmarks would typically be broad equity market indices or sector-specific indices, depending on the fund’s focus. For debt-oriented strategies, relevant debt market indices based on credit quality and duration would be appropriate. Hybrid strategies would likely use a composite benchmark that reflects the allocation between equity and debt in the fund’s portfolio. 

When evaluating the performance of SIFs, HNIs should consider various metrics beyond just absolute returns. Risk-adjusted returns, which take into account the level of risk taken to achieve those returns, are particularly important for SIFs given their potentially higher risk profile. 

Consistency of performance over different market cycles is another key factor to assess. Comparing the fund’s performance against its designated benchmark(s) will help investors determine if the fund manager is adding value beyond what could be achieved by simply investing in a passive index. 

Risk Management in SIFs

SIFs are susceptible to overall market fluctuations, and the specific asset classes they invest in carry their own inherent risks, such as equity market volatility and credit and duration risk in debt markets. 

The investment strategies employed by SIFs also introduce specific risks. For instance, short selling carries the potential for unlimited losses if the price of the shorted stock rises instead of falling. The reliance on the fund manager’s expertise and decision-making is particularly critical for these complex strategies, introducing fund manager risk. 

Liquidity risk can also be a concern, especially for SIFs investing in less liquid assets or those with close-ended structures, and investors should be aware of potential notice periods for redemption. 

While these risks are significant, the regulatory framework does incorporate certain safeguards to protect investors, such as limits on investment exposures and mandatory disclosure requirements. Additionally, AMCs are required to disclose the risk level associated with each SIF strategy through a “Risk-band,” a pictorial risk meter similar to that used for mutual funds.

Factors to Consider Before Investing in SIFs

Before investing in Specialised Investment Funds, HNIs should carefully consider several crucial factors. The investment horizon should align with the potentially longer timeframes associated with the alternative asset classes that SIFs may invest in. 

Assess Risk Appetite:

Investors must honestly assess their own risk appetite and ensure they are comfortable with the higher levels of investment risk inherent in SIFs. The mandatory minimum investment of ₹10 lakh should be within their investment capacity. 

Familiarity with Investments:

A thorough understanding of the specific sectors and investment strategies targeted by the SIF, along with an evaluation of their growth prospects and associated risks, is essential. It is also important to research the experience and track record of the fund manager and the AMC managing the SIF. 

Understanding of the Fund Structure:

Investors should understand the fund’s structure (open-ended, close-ended, or interval) and the potential limitations on liquidity, including any applicable notice periods for redemption; for close-ended and interval funds, the listing on stock exchanges as a potential exit route should be noted. 

Fees:

The fees and expenses associated with the SIF should be carefully reviewed, as they can impact overall returns. It is crucial to verify that the SIF is indeed regulated by SEBI and complies with all relevant guidelines. 

Tax Implications: 

Understanding the tax implications of investing in SIFs, which are similar to those of equity mutual funds regarding capital gains tax, is important. The due diligence process for SIFs is more critical than for traditional mutual funds due to their increased complexity and risk. 

HNIs need to examine the specifics of the fund’s strategy and the fund manager’s expertise. 

Prospective investors should also meticulously review the offer documents and the Investment Strategy Information Document (ISID) to fully comprehend the fund’s objectives, strategies, risks, and terms and conditions. 

Who Should Consider Investing in SIFs?

Specialised Investment Funds are designed for a specific segment of investors who possess certain characteristics and investment profiles. These funds are generally suitable for experienced investors who have a strong understanding of financial markets and various investment strategies, including potentially complex ones like long-short strategies and derivatives. 

Given the minimum investment threshold, SIFs are primarily targeted towards High Net-worth Individuals (HNIs) who meet the financial criteria and have the capacity to absorb potential investment losses. Sophisticated investors seeking advanced and flexible investment options that go beyond the scope of traditional mutual funds and who are potentially looking for higher returns may find SIFs appealing. 

Investors with a higher tolerance for risk and who are comfortable with the potential for significant volatility and losses in pursuit of potentially greater returns are also well-suited for SIFs. 

Those with a long-term investment horizon that aligns with the potentially extended time frames required for some of the alternative asset classes and strategies employed by SIFs should consider them. 

Finally, investors looking to further diversify their portfolios into niche markets and alternative asset classes that are not readily accessible through conventional investment routes might find SIFs to be a valuable addition. 

SIFs are not a one-size-fits-all investment solution and are specifically tailored for a segment of the market with a particular risk appetite, financial capacity, and investment knowledge. HNIs

who are new to investing or prefer a more conservative approach might find SIFs less suitable for their portfolio.

How EquiZen Can Help with SIF Investments

As a dedicated wealth management service for High Net-worth Individuals in the Indian market, EquiZen is well-positioned to assist you in navigating the landscape of Specialised Investment Funds. 

Our experienced financial advisors possess a deep understanding of the intricacies of SIFs and can provide expert guidance tailored to your specific financial goals and risk tolerance. We can help you understand the nuances of different SIF strategies, evaluate their suitability for your portfolio, and conduct thorough due diligence on various fund offerings.

Conclusion

Specialised Investment Funds in India present a unique set of opportunities for High Net-worth Individuals seeking to enhance their portfolio diversification and potentially achieve higher returns through access to niche markets and sophisticated investment strategies. 

However, it is crucial to recognize that these opportunities come with a higher degree of risk compared to traditional investment options. Therefore, before considering an investment in SIFs, HNIs must conduct thorough research and due diligence to fully understand the specific investment strategies, the expertise of the fund manager, the associated risks, and the regulatory framework governing these funds. 

Given the complexity and the potential for significant financial implications, it is highly advisable for HNIs to consult with their financial advisors to determine if SIFs align with their individual investment goals, risk tolerance, and overall financial plan. A well-informed decision, based on a comprehensive understanding of the intricacies of SIFs, is paramount for HNIs looking to explore this evolving investment landscape.

Smart Beta funds for HNIs: Elevate Your Portfolio

For high-net-worth individuals (HNIs) seeking to optimize their investment portfolios, the landscape of exchange-traded funds (ETFs) offers a diverse array of opportunities. Among these, smart beta ETFs and funds have emerged as a sophisticated tool for enhancing diversification, managing risk, and potentially achieving superior returns compared to traditional market-cap weighted indices. This guide provides a strategic overview of smart beta ETFs and funds, tailored to the unique needs and complexities of HNI investment strategies.

What are Smart Beta ETFs & Funds?

Traditional ETFs typically track market-capitalization weighted indices, meaning the weight of each stock in the index is proportional to its market value. Smart beta ETFs, in contrast, employ rules-based methodologies to select and weight stocks based on specific factors that have historically demonstrated the potential for outperformance or risk reduction. 

These factors can include characteristics like value, momentum, quality, low volatility, alpha, etc. By moving beyond simple market capitalization, smart beta ETFs offer a strategic approach to gaining targeted exposure to specific market dynamics.

Strategic Integration of Smart Beta ETFs in HNI Portfolios

Smart beta ETFs can be strategically integrated into diverse and substantial HNI investment portfolios to achieve specific financial objectives:

Enhanced Diversification:

By providing exposure to factors beyond market capitalization, smart beta ETFs can help diversify portfolios and reduce overall risk. This can be particularly valuable in large portfolios with existing broad market exposure. 

Targeted Risk Management:

Low volatility smart beta ETFs, for instance, can be used to mitigate downside risk in portfolios, which can be a key consideration for HNIs seeking lower risk investments.

Potential for Outperformance:

By focusing on factors with a historical track record of delivering excess returns, smart beta ETFs offer the potential to enhance overall portfolio performance.

Advanced Smart Beta Strategies for Sophisticated Investors

For HNIs with a nuanced understanding of market dynamics, advanced smart beta strategies can be particularly compelling. 

Multi-Factor Investing:

Rather than focusing on a single factor, multi-factor ETFs combine several factors into one fund. This approach can potentially lead to more stable outperformance across different market cycles, as various factors tend to perform differently at different times. 

Factor Rotation:

This more dynamic strategy involves shifting exposure between different factors based on macroeconomic conditions and market outlook. While potentially offering higher returns, factor rotation requires a deeper understanding of market trends and may involve more active management considerations.

A Deep Dive into Key Smart Beta Factors

Understanding the underlying factors driving smart beta ETFs is crucial for informed decision-making: 

  • Value: Investing in undervalued stocks with strong fundamentals. 
  • Momentum: Investing in stocks that have shown strong price performance over a specific period. 
  • Quality: Investing in companies with high profitability, low debt, and stable earnings.
  • Low Volatility: Investing in stocks with historically lower price fluctuations.
  • Alpha: Investing in companies who have outperformed their expected returns. 

It’s important to note that the performance of these factors can be cyclical, and no single factor consistently outperforms in all market environments.

Real-World Applications: Smart Beta in Action for HNIs

Consider an HNI seeking to enhance the income generation of their portfolio without significantly increasing risk. They might allocate a portion of their holdings to a low volatility equity ETF, which tends to hold stocks with lower price swings. Alternatively, for an HNI with a long-term growth objective, a multi-factor ETF combining value and quality factors could provide diversified exposure to potentially high-performing companies.

Navigating the Risk-Reward Landscape

While smart beta ETFs offer numerous potential benefits, it’s essential for HNIs to understand the associated risks. These can include the possibility of factor underperformance, higher costs compared to traditional market-cap weighted ETFs, and the complexity of understanding and selecting the appropriate smart beta strategies. A thorough understanding of the chosen factors and the ETF’s methodology is crucial.

Strategic Diversification within Complex Portfolios

For HNIs managing substantial and diverse portfolios, smart beta ETFs can be a valuable tool for achieving granular diversification. They allow for targeted exposure to specific market segments or investment styles that might be underrepresented in a traditional portfolio. This can lead to a more balanced and resilient overall investment strategy.

Key Tax Considerations for HNIs

As with any investment, HNIs should consider the potential tax implications of investing in smart beta ETFs. Factors such as dividend distributions and capital gains from trading within the ETF can have tax consequences that should be factored into the overall investment strategy. Consulting with a tax advisor is recommended to understand the specific implications based on individual circumstances.

How EquiZen Empowers HNIs in Smart Beta Investing

Navigating the world of smart beta ETFs requires a deep understanding of factor investing, market dynamics, and portfolio construction. EquiZen provides HNIs with the expertise and personalized guidance needed to effectively incorporate smart beta strategies into their investment portfolios. We offer: 

  • Personalized Consultation: We work closely with you to understand your unique investment objectives, risk tolerance, and long-term financial goals. Based on this understanding, we provide tailored recommendations on whether and how smart beta ETFs can align with your overall strategy.
  • Expert Selection and Due Diligence: With a vast array of smart beta ETFs available, selecting the right ones can be challenging. We conduct rigorous due diligence to identify ETFs that align with your specific factor preferences and investment philosophy. We analyze the underlying methodologies, track records, and expense ratios to ensure optimal choices.
  • Strategic Portfolio Integration: We don’t just recommend individual ETFs; we focus on how smart beta can be strategically integrated into your existing portfolio to enhance diversification and achieve your desired factor exposures. We consider the interplay between different asset classes and investment strategies to create a cohesive and effective portfolio.
  • Risk Management and Monitoring: Investing in smart beta ETFs involves understanding factor cyclicality and potential periods of underperformance. EquiZen provides ongoing monitoring of your smart beta investments, helping you stay informed and make adjustments as needed to manage risk effectively.
  • Educational Resources and Insights: We empower our clients with the knowledge to make informed investment decisions. Through regular updates, market insights, and educational resources, we help you understand the rationale behind our smart beta recommendations and stay abreast of the latest developments in factor investing.

Harnessing the Power of Smart Beta

Smart beta ETFs represent a significant evolution in passive investing, offering HNIs a strategic and rules-based approach to potentially enhance portfolio outcomes. By understanding the underlying factors, advanced strategies, and the associated risks and rewards, HNIs can leverage these innovative investment vehicles to elevate their portfolios and work towards their long-term financial goals. EquiZen is committed to providing tailored guidance to help you navigate the complexities of smart beta ETFs and integrate them effectively into your wealth management strategy.

India’s Mutual Fund Flows – March 2025: Equity lumps investments dry up

The Indian mutual fund industry ended the financial years with assets of Rs 65.74 lakh crores. The Industry witnessed net outflows of Rs 1.64 lakh crores due to outflows from debt schemes to pay advance tax as well as not show investments in mutual funds at the end of the year on their balance sheets. The equity markets did well in March with the broader as well as large cap indices showing good gains. The Nifty 500 was up 7.35% and the Nifty 50 was up 6.31%. This helped the equity assets to increase to Rs 29.45 lakh crores. Other asset classes such as hybrids as well as passive funds also saw an increase in assets.

Mutual Fund Industry Overview – March 2025

🔹 Total AUM & Net Inflows:

– The mutual fund industry’s total AUM stood at 65.74 lakh crore, reflecting an 23.1% YoY increase.  

– It was also up by 1.04% from February 2025. 

– The monthly inflows were hugely negative due to debt schemes.  Inflows were positive in the last two months.  The net outflow in this March was almost similar to the outflows seen in March 2024.

🔹 Monthly flow and AUM trends:

Equity Mutual Funds :

– This is the fourth consecutive month that saw net inflows into equity schemes seeing a decline.  Flows have fallen to Rs 25,082 crs from Rs 41,156 crs in December 2024.  

– SIP flows have also fallen.  They were Rs 26,459 crores in December 2024 and are now Rs 25,926 crs.  This is not as big a reduction as in lumpsum flows.  SIPs tend to be stickier and these numbers bear them out.  

– Net flows in equity mutual funds are lower than SIP flows which show that lumpsum investments have dried up.  One year returns are now in single digits and three month returns are negative.  Investors should stop looking at past returns to determine the timing of their investments.  This is the time when SIPs will average out the cost of units and give higher returns when markets go up in the future.  Hope investors not only not stop their SIPs but also not redeem their investments and stay invested.  Returns are compounded over long periods of time.  

Sectoral/Thematic Funds: 170 crore  

– Flexi-Cap Funds: 5,615 crore

– Small-Cap Funds: 4,092 crore  

– Mid-Cap Funds: 3,439 crore  

Thematic funds have shown a big dip in flows compared to a few months ago.  This may be due to a lack of NFOs in this space.  The AUM of thematic funds has shown a growth of 53% over the last one year compared to the overall growth of 25% in all equity categories.  The lowest growth was shown by ELSS funds.  They grew by 8.6% over one year.  

📌 #EquityFunds #MutualFunds #WealthCreation #LongTermInvestment #EquityMarket #ELSSschemes #Equityschemes

Debt Funds: Outflows due to the end of the financial year

The debt mutual fund segment saw large outflows due to the financial year end as well as the last advance tax instalment due in the middle of March.  Outflows in this March were just a bit higher than last year but much more than that in December 2024 which was a quarter end month.

📉 Key Trends in Debt Funds:

Total debt fund AUM was 15.08 lakh crore, a 11.0% dip compared to last month but up by about 20% compared to last year as well as up by 17% over three years.  

– Liquid and money market funds saw the largest fall in AUM due to year end outflows.  Corporate bond funds as well as short term bond funds saw an increase in AUM inspite of outflows.  This may be due to reduction in interest rates leading to increase in prices of bonds.  

– Liquid funds saw the largest outflow followed by overnight funds and then money market funds.  This caused the AUM of liquid funds to fall below that of thematic and flexi cap funds.  

– Gilt and long duration funds have shown a good growth in AUM over the last one year mainly to take advantage of an anticipated fall in interest rates.  However, the assets of these schemes continue to remain quite small indicating that they are still a niche play.  Money market funds have also shown a good increase of over 50% compared to last year and are now the second largest debt funds category.  

#DebtFunds #InterestRates #BondMarket #FixedIncome #FinancialPlanning

Hybrid & Passive Funds: Shift towards multi asset funds

Net inflows into hybrid funds stood at –947 crore, led by Arbitrage funds, which saw outflows of  2,855 crore in March.

📊 Hybrid Funds Inflows Breakdown:

Arbitrage Funds: –2,855 crore  

– Multi-Asset Allocation Funds: 1,670 crore  

– Dynamic Asset Allocation/Balanced Advantage Funds: 776 crore  

📌 #HybridFunds #Diversification #RiskManagement #BalancedInvestment

🧐 Why the Shift to Multi Asset Funds?

– Multi-asset allocation funds provide diversification, making them a preferred choice in uncertain market conditions.  These funds are the fastest growing category of hybrid funds providing investors with double digit returns with low volatility.   

📌 #MutualFundIndia #InvestWisely #GrowYourMoney #PersonalFinance #IndiaMarkets #InvestmentGoals

About EquiZen

EquiZen, a registered mutual fund and PMS distributor, offers personalised financial solutions with a focus on safety and transparency. We aim to assist you to achieve financial freedom, the freedom to do what you want and achieve your dreams.  We do not push financial products but believe utilising them judiciously to meet your needs.  Learn more at www.equizen.in or contact us via +91 9820605203 or sanjay@equizen.in.

Retail Investors Are Missing Out on Debt Mutual Funds

As a CA and CFA with over 20 years of experience in the financial domain, I’ve observed a concerning trend among retail investors: a significant lack of participation in debt mutual funds and an overexposure to high-risk equity schemes. This imbalance in asset allocation can have long-term implications for their financial health. Let’s break it down.

The Debt Mutual Fund Gap

In June 2024, we highlighted the lack of retail investor interest in debt mutual funds. Despite debt mutual funds accounting for nearly 25% of the mutual fund industry’s assets, retail investors continue to overlook these schemes. Here’s what the data as of December 31, 2024, reveals:

– Liquid Funds: Retail AUM is just 1.36%, while HNIs hold 13.81%.

– Corporate Bond Funds: Retail AUM is 1.54%, compared to 24.65% for HNIs.

– Banking & PSU Debt Funds: Retail AUM is 1.69%, while HNIs hold 31.44%.

Retail investors are missing out on higher returns (6.5%+ in liquid and low-duration funds) compared to the meagre 3.5% offered by savings bank accounts. Additionally, they seem to prefer fixed deposits and bonds over long-term debt schemes, sacrificing liquidity and diversification benefits.

The Equity Overexposure Problem

On the other hand, retail investors are taking aggressive bets in equity schemes:

– Mid-Cap Funds: Retail AUM is 56.88%.

– Small-Cap Funds: Retail AUM is 64.13%.

While mid and small-cap funds can offer higher returns, they come with significantly higher risk. Retail investors hold disproportionately lower percentages in conservative schemes like hybrid funds (14.85%) and arbitrage funds (1.25%).

The Need for Balanced Allocation

The data suggests that retail investors are not diversifying their portfolios adequately. Overexposure to high-risk equity schemes can lead to significant volatility, especially during market downturns. A well-balanced portfolio should include a mix of debt, equity, and hybrid funds, with aggressive equity exposure limited to 30-35% of the total equity allocation.

What Can Be Done?

1. Financial Literacy: Retail investors need to understand the benefits of debt mutual funds, including higher returns, liquidity, and risk diversification.

2. Advisor Guidance: Distributors and wealth managers should encourage balanced asset allocation across all categories.

3. AMC Initiatives: Asset Management Companies could target retail investors with better pricing and education on regular plan TERs.

At EquiZen, we specialise in personalised financial solutions that prioritise safety and transparency. Our goal is to help you achieve financial freedom by making informed decisions. If you’re looking to optimise your portfolio, let’s connect.  Send us a mail on sanjay@equizen.in or call on 9820605203.

#WealthManagement #MutualFunds #FinancialPlanning #DebtFunds #EquityInvesting #HNIs #EquiZen

India’s Mutual Fund Industry Hits a Record High in January 2025: AUM Surpasses ₹67.25 Lakh Crore

The Indian mutual fund industry continued its remarkable growth trajectory in January 2025, with total  assets under management (AUM) reaching an all-time high of 67.25 lakh crore. This marks a 0.48%  increase from December 2024 and an impressive 27.52% growth year-on-year. Despite ongoing  market fluctuations, investors remain committed to mutual fund investments, ensuring steady inflows  across various fund categories. Let’s dive deeper into the key trends shaping India’s mutual fund  industry.

Equity Mutual Funds: Strong Inflows Despite Market Volatility

Equity mutual funds continued to attract significant investor interest in January, with net inflows of  39,688 crore. This was the fourth-highest monthly inflow ever recorded, demonstrating investor  confidence in the long-term growth potential of Indian equities. However, due to market corrections,  the total AUM for equity-oriented funds declined by 3.6% to 29.47 lakh crore.  

Sectoral and Mid/Small-Cap Funds Dominate Inflows  

– Sectoral/thematic funds led the way, attracting the highest inflows within equity-oriented funds.  

– Mid-cap and small-cap funds saw their highest-ever monthly inflows, reinforcing the growing  investor appetite for these high-growth segments.  

– Large-cap and flexi-cap funds also saw strong inflows, ranking second-highest in their history.  

– New Fund Offerings (NFOs) continued to be a major driver, with small-cap NFOs raising 1,040  crore and sectoral/thematic NFOs mobilising 2,838 crore.  

Thematic/sectoral funds continue to attract the highest inflows amongst all equity schemes. Nov and  Jan have seen the inflows dip below Rs 10,000 crs whereas it was more than 13,000 crs in the three  months each ending Oct 2024. Thematic NFOs in Jan brought in 2838 crores.  

Market Impact: Equity AUM Faces Pressure  

Despite strong inflows, the equity AUM experienced a decline of 3.62% due to mark-to-market losses  as the benchmark indices, Nifty 50 and BSE Sensex, dropped by 0.45% and 0.78%, respectively.  Nonetheless, domestic institutional investors (DIIs) played a stabilising role by continuing their equity  purchases, mitigating the impact of foreign institutional outflows.

Debt Funds: A New High at ₹17.06 Lakh Crore

Debt mutual funds saw their AUM climb to an all-time high of 17.06 lakh crore, growing 8.9% on a  monthly basis. January also saw net inflows of 1.29 lakh crore into debt funds, reversing the  significant net outflows of 1.27 lakh crore seen in December 2024. As usual, the first month of the  new quarter saw monies that had gone out in the previous month come back again. The seven day exit load now levied by all mutual funds needs to be reviewed as it may not have worked in changing the  nature of quarterly inflows and outflows.

Key Drivers of Debt Fund Growth

  1. Liquid and Money Market Funds Lead Inflows  

 – Liquid funds recorded a staggering inflow of 91,593 crore, accounting for 71% of total debt fund  inflows.  

 – Money market funds also performed well, receiving 21,916 crore in inflows.  

  1. Declining Bond Yields Attract Investors  

 – The yield on the 10-year government bond fell from 6.76% in December 2024 to 6.69% in January  2025, making fixed-income investments more attractive. Though, declining yields can lead to better  returns, funds which can take advantage of declining yields such as gilt funds with 10 year constant  duration, medium and long term duration funds, credit risk funds, etc have seen outflows. Either very  few people are expecting interest rates to decline else they are allocated to equity and hence not  looking at a kicker from debt funds.  

  1. Short-Term Funds Dominate  

 – Overnight funds, liquid funds, and money market funds saw the highest month-on-month growth,  at 26.3%, 20.4%, and 10.2%, respectively.  

 – Investors preferred shorter-duration funds as they offered better liquidity and lower risk in a  volatile environment. 

Hybrid Funds: Continued Momentum in Arbitrage and Multi-Asset Funds

Hybrid funds witnessed net inflows of 8,768 crore in January, more than doubling from 4,370 crore  in December 2024. While the category’s total AUM declined slightly by 0.14% to 8.75 lakh crore due  to market fluctuations, investor interest in hybrid strategies remained strong.  

 Arbitrage Funds Take the Lead  

– Arbitrage funds alone accounted for nearly half of hybrid fund inflows, attracting 4,292 crore in  January.  

– Their AUM grew by 2.16% month-on-month to cross 2 lakh crore. Arbitrage fund inflows turned  hugely positive as they were negative in three out of the last four months. Have investors booked  some profits or are they parking their lumps funds in Arbitrage to move to equities later?  

Multi-Asset Allocation Funds Surge 

– Multi-asset allocation funds have grown nearly fourfold over the past three years, reflecting  investors’ increasing preference for diversified portfolios. This is a good sign as these funds are  inherently less volatile as they have a mix of three asset classes mainly equity, debt and gold which 

have low positive correlation amongst them. Investors should move from debt to hybrid and then to  equity schemes. Multi asset funds are a great way to progress for cautious investors. In the same  breath, conservative hybrid funds have seen negative flows for the last three months. Are all the new  investors directly coming into equities?

Passive Investments Surge: Gold ETFs and Index Funds Shine

Passive investment strategies continued their strong run, with inflows of 10,255 crore in January. This  marked the 51st consecutive month of positive inflows into passive funds.  

 Gold ETFs Hit Record Inflows  

– Gold ETFs saw their highest-ever monthly inflow of 3,751 crore as investors turned to safe-haven  assets amid market uncertainty.  

– The depreciating Indian rupee and global economic concerns contributed to heightened interest in  gold-backed instruments.  

 Index Funds Continue to Attract Investors  

– Index funds accounted for the largest inflows within the passive category, receiving 5,255 crore in  fresh investments.  

– The AUM of index funds grew to 2.76 lakh crore, reflecting increased adoption of low-cost, passive  investing strategies.

SIP Contributions Hit ₹26,400 Crore, AUM at ₹13.20 Lakh Crore

Systematic Investment Plans (SIPs) maintained their steady growth, with contributions reaching  26,400 crore in January, up 40.14% from 18,838 crore a year ago. The total SIP AUM now stands at  13.20 lakh crore, accounting for nearly 20% of the overall mutual fund industry assets.  

This growth underscores investors’ confidence in a disciplined, long-term approach to wealth creation,  even amid short-term market turbulence. Its good that the market volatility has not reduced SIP  inflows. SIP inflows probably stay for a longer term than lumps sum inflows.

Folio Growth: 50 Straight Months of Expansion

January also saw a record increase in the number of mutual fund folios, with 41.96 lakh new accounts  added. The total folio count now stands at 22.92 crore, up 1.86% from December.  

– Equity-oriented folios led the expansion, contributing over 30.78 lakh new accounts.  – Passive funds accounted for 9.43 lakh new folios, driven by index and ETF investments. 

The sustained folio growth highlights increasing retail participation and a broader investor base in  India’s mutual fund ecosystem. As we had mentioned in our earlier blogs, there is hardly any new  folios being created in debt schemes. The entire debt mutual fund ecosystem is tailored towards  corporates and UHNIs.  

Outlook: Strong Flows Expected Despite Market Fluctuations  

The Indian mutual fund industry continues to show resilience and sustained growth. The steady rise in  AUM, robust SIP inflows, and increasing investor participation signal strong confidence in the market.  While short-term volatility may persist, long-term prospects remain bright, particularly for equity,  passive, and hybrid funds.  

 Key Takeaways:  

– Mutual fund AUM reached 67.25 lakh crore, growing 27.52% year-on-year.  

– Equity funds saw 39,688 crore in inflows, despite market corrections.  

– Debt fund AUM hit a record 17.06 lakh crore, benefiting from falling bond yields.  

– SIP contributions remained steady at 26,400 crore, highlighting retail investor confidence.  – Gold ETFs recorded their highest-ever inflows at 3,751 crore.  

As we move further into 2025, mutual funds continue to offer attractive investment opportunities,  reinforcing their role as a key pillar of wealth creation for Indian investors.  

Disclaimer: Mutual fund investments are subject to market risks. Read all scheme-related documents  carefully before investing.

Selecting a Mutual Fund Scheme

To navigate the vast array of funds: 

  1. Start with Asset Allocation: Define equity, debt, and gold proportions. A typical mix: 60%  large-cap, 25% mid-cap, 15% small-cap. Given the recent run up and correction in mid and  small caps, we advise sticking to large caps till there is a higher correction in this part of the  market.  
  2. Diversify Wisely: Limit to ~10 schemes across categories and not more than 1-2 schemes  across one category.  
  3. Key Metrics: Analyze 3-5 year performance, volatility, portfolio turnover, and fund manager  consistency. 
  4. Review Regularly: Annual or semi-annual reviews are essential. 

For simplicity, leverage mutual fund ratings by CRISIL, ICRA, etc., favouring 4-star schemes.

About EquiZen

EquiZen, a registered mutual fund and PMS distributor, offers personalised financial solutions with a  focus on safety and transparency. We aim to assist you to achieve financial freedom, the freedom to do  what you want and achieve your dreams. We do not push financial products but believe utilising them  judiciously to meet your needs. Learn more at www.equizen.in or contact us via +91 9820605203 or sanjay@equizen.in.

Mutual Fund flows in December 2024

In this post, we analyse the assets and flows in India’s mutual fund industry in the month of December 2024.

Total Assets Under Management (AUM):

Total AUM of all schemes declined by 1.69% over November 2024 to Rs 66.93 lakh crores but was still an impressive 31.81% up over the December 2023 number. That number was 50.77 lakh crores. The AUM year on year growth last month was 38% and the downfall in the markets has dragged the growth rate down but is still quite a good number. Nifty 50 was down 2.02% in December. Its one year return is 10.09%. Mid caps and small caps were up 1% and 0.2% respectively in one month.

Debt assets ( or funds in debt schemes) were down 7% as overnight, liquid and money market funds saw significant net outflows. Equity assets were up 0.71% to 30.57 lakh crores. Hybrid assets were flat at Rs 8.76 lakh crores. Assets under management of mid cap and sectoral schemes was up by two odd percent. Sectoral schemes net inflows jumped twice over that in November 2024 mainly driven by NFOs.

Over the last ten years, the broader market (Nifty 500) has given a return of 19%. Out of twenty sectoral indices, only ten have given a return more than 19%. The highest return of 29% was given by realty index followed by metals at 27.27%. Surprisingly, financial services and banks were lagging the broader market at 10% only. PSU banks have outperformed at 22% whereas private banks were at 7.42 % only. The returns of the broader market are an average of the returns of all the sectors and their stocks. It’s quite hard to determine which sectors will do well. Even the FMCG sector has lagged though consumer durables has done well. Since the broader market is an average of all the sectors and stocks, its volatility will also be lower than that of the sectoral indices. Nifty 500 one year volatility is 15% and only Pharma, FMCG and healthcare had slightly lower volatility than 15%. The highest volatility was shown by PSU bank at 29% followed by media and realty. Investors are advised to consider the volatility of sector funds too while determining their asset allocations.

Equity schemes:

Gross and net inflows were up for both equity and hybrid schemes in December 2024 over the previous month. Gross flows into equity at 72,115 crores and net inflows at 41,115 crores were up by 17% and 14.5% respectively. Mid cap and small cap funds are seeing increase in both gross and net inflows though the outflows in mid caps seems to be increasing too. Does this explain the resilience of these indices in this month?

Sectoral funds AUM is now the largest in the equity category by a mile. It is at 4.72 lakh crores and will likely cross 5 lakh crores by March 31, 2025. It has become the single largest AUM category since liquid funds saw huge outflows in December. While liquid may come back in January, it is likely that the steady inflow into sectoral funds will make it the largest category of schemes in a short time barring other ETFs. These ETFs have many institutional investors and hence may keep growing too.

Are investors taking advantage of the dip in the markets to increase their exposure. Arbitrage funds have seen an outflow in the month. Long investors of course will benefit by investing at lower levels. The recent downturn in the markets over the last 3-4 months is also good for SIP and STP investors who get an opportunity to lower their average cost of investments and improve their long term returns. But those looking for short term high returns may face disappointments. We will have to wait and watch. The drivers of the markets in the short term will be quarterly results, the budget, the change of guard in the US, the US Fed and RBI monetary policy actions, etc.

Hybrid schemes:

Hybrid funds gross inflows (excluding arbitrage schemes) was Rs 13,279 crores which is around 20% of the gross inflows into equity schemes. Indian savers are still addicted to fixed income investments. They still love guaranteed returns and the higher the better. Instead of falling to scams, they will be better off investing in hybrid schemes. Those with a lower ability to stomach risk can look at conservative hybrid funds or multi asset allocation funds which have give decent low volatile returns over the years.

Number of mutual fund schemes:

The mutual fund industry offers a total of 1666 schemes of which 1552 are open ended schemes and 114 are close ended schemes. There are 315 debt schemes, 481 equity schemes of which 190 are sectoral schemes. The number of hybrid schemes are 160 and the number of index funds and ETFs are 556. Given the change in taxation laws, the number of close ended schemes have dwindled else the total number of schemes would have been very high.

How to select a mutual fund scheme?

How does one navigate so many schemes? Also, given the plethora of schemes, it is natural to invest in many schemes and over-diversify your assets. Its best to start with your asset allocation. Determine your optimal allocation to equity, debt and gold. Thereafter, allocation assets to large, mid and small cap schemes. A good proportion would by 60-25-15. Allocation to debt could be across money market, gilt, corporate bond and medium duration schemes. Gold exposure can be taken via ETFs or FOFs investing in Gold ETFs. A number of 2 schemes in each of these categories should be sufficient. A total of ten schemes across all these asset classes should be a good number to target. Consider 3 & 5 year performance, standard deviation of these returns, portfolio turnover ratio and fund manager duration while selecting schemes. Review these parameters at least once a year if not twice. If you use the above criteria, you will most probably not consider New Fund offers. NFOs can be considered for allocation to new themes. In any case thematic allocation should not exceed ten percent of your equity allocation. Allocation to debt assets can cover investment in CDs, PPF, etc. Tax aspects should be considered while choosing all investment options.

If this sounds overwhelming, one can take the easy way out by looking at mutual fund scheme ratings issued by Crisil, ICRA and other such agencies. They do the rankings on a similar basis as discussed above. One can invest in four star rated schemes since we are not a fan of five star schemes since the only way for them is to go down.

About EquiZen

EquiZen is a registered mutual fund and PMS distributor. Our team is highly qualified in investments and finance, offering tailored solutions to meet your dreams. We prioritise safety and transparency, ensuring that we recommend only investments we will invest ourselves. Visit [www.equizen.in](http://www.equizen.in) or contact us at +91 9820605203 via call or WhatsApp. You can also write to us at sanjay@equizen.in for a free consultation. Let’s secure your financial future together.

Mutual Fund flows in November 2024

In this post, we analyse the assets and flows in India’s mutual fund industry in the month of November 2024.

Total Assets Under Management (AUM):

Total AUM of all schemes was close to Rs 68.08 lakh crores as on November 30, 2024. It was just a tad up (1.23%) compared to October 2024 but was up 38% compared to twelve months ago. Markets were mainly flat for the month. Equity and Debt AUMs were both up by around a percentage helping in the growth of the month end AUM. Average AUM for the month was down 0.66% compared to last month. Average AUMs were down mainly due to lower equity AUMs. This may be due to volatility of the equity market indices during the month.

Why is average AUM being reported and how is it computed? Average AUM is the average of the daily AUMs of the schemes divided by the number of business days in the month. There was a time in the industry when debt AUM was larger than equity AUM. It was possible to get AUM on the last day of the month to show a higher number for reporting purposes. Accordingly, the industry decided to report Average AUM rather than just the month end AUM. Since the equity AUM has grown much larger now, this practice may not be required anymore. However, a practice once initiated isn’t easy to be changed or stopped.

Equity schemes

Gross inflows into equity schemes were at Rs 61,697 crs in the month of November 2024 compared to Rs 74,727 crs in October 2024 and Rs 38,885 crs in November 2023. Compared to last year, its an impressive growth of 58.66%. But sectoral funds have shown the biggest increase in gross flows compared to last year. Net flows into equity schemes were 14% lower compared to last month but 131% higher than November 2023. They were at Rs 35,943 crs in November 2024.

What explains the dip in gross inflows compared to the previous month? Is it the volatility of the index and the fall from 86,000 to the current 81,000 odd. Are we still looking at monthly and half yearly and annual returns only rather than much longer periods? What will happen if the market consolidates for the next six months. Many NFOs are below their face value. Will (or have) these investors backed out from committing more funds to equity mutual funds?

Hybrid schemes

Hybrid schemes too saw a dip in gross and net flows. We have always felt that Arbitrage funds are skewing the data for hybrid funds and should be shown separately. The gross inflows in these schemes was down 36% to Rs 29,279 crs. Net inflows were down 75%.

Fund of funds investing in overseas equities saw an increase in AUM of 3.5% even though net flows were negative as the US and Chinese markets have done well. Trump’s election victory has been good for developed markets but negative for emerging market equity indices.

Debt (Fixed income) schemes

Debt or Fixed income Assets under Management rose by 1.32% to 16,85,672 crores at the end of November 2024.

The AUM per folio of debt schemes is at 24.58 lakhs. The highest AUM per folio is 58 lakhs for money market funds. The average AUM per folio of equity schemes is Rs 1.96 lakhs and that of hybrid schemes is Rs 5.82 lakhs again skewed by Arbitrage schemes whose average is Rs 34.86 lakhs. This indicates that even arbitrage schemes are used by corporates to earn higher net of tax returns than debt schemes.

In November 2020, the AUM of Fixed Term Plans was Rs 1,18,458 crores. Five years later the AUM of these schemes has shrunk to Rs 15,676 crores. The change in taxation of debt scheme has killed this category of schemes. They were a great alternative to Fixed deposits as well as bonds and debentures. But they were also mainly a corporate and HNI product. A substitute in terms of open ended debt index funds did well too till the tax regime was beneficial. While the government has brought the tax regime on par with fixed deposits, wonder whether they have evaluated the impact on funding for corporates on the same. Corporates could raise debt funds by issuing papers to these schemes. This was a good way of raising funds for 2-3 years. A detailed evaluation of this aspect would be interesting to read.

Mutual Fund flows in September 2024

In this post, we analyse the assets and the flows in India’s mutual fund industry in the month of September 2024.

Total Assets Under Management (AUM):

Total AUM of all schemes was close to Rs 67.09 lakh crores as on September 30, 2024. It was just a tad up compared to August 2024 mainly due to outflows from debt schemes due to the end of the quarter. We should see the same being made up in the month of October. Total assets were up 44% compared to September 2023. Thematic funds AUM is at 467,000 crores and will likely be the second category to touch 5,00,000 crores of assets after liquid funds category. This should happen in the next 2-3 months as the assets grew at 5% compared to the previous month. Other ETFs are the largest category at 810,000 crores. However, that would include many index funds as well as some actively managed ETFs too.

Equity and Hybrid schemes

Gross inflows in equity and hybrid schemes were flat compared to last month. Net inflows in equity schemes were up almost 1.5 times compared to that of last year. Hybrid schemes saw net outflows compared to last month mainly due to outflows from arbitrage funds. It’s time AMFI classified these schemes with debt funds so analysts do not have to make adjustments with pure hybrid funds. Four thematic NFOs collected Rs 7,842 crores. Thirteen index funds collected Rs 3,656 crores whereas four other ETFs collected Rs 102 crores only. The clear preference for thematic funds is obvious. The tendency to sell past performance will take some time to become outdated. Asset Management Companies are also making hay when the sun is shining by launching as many NFOs as possible.

Mutual fund advisors don’t earn trail fees from selling ETFs. ETFs will continue to be a product that is pushed by RIAs and favoured by HNIs and Family offices as well as those institutions looking at index exposures. As we had observed, the debt and ETF products will not be sold by advisors due to lower commissions. Only when equity funds become so big that commission rates go lower that advisors will become indifferent between debt and equity schemes at least from an income perspective and they will not be averse to becoming asset allocators to just selling performance.

Debt (Fixed income) schemes:

Debt or Fixed income Assets under Management fell by 6.41% to 14,97,000 crores at the end of September 2024. Schemes which saw net outflows were overnight, liquid, ultra short term bond funds, money market funds, floater funds, Banking and PSU Bond funds and credit risk funds. With RBI changing its stance to neutral, will there be an increase in the assets of gilt funds? Currently, these funds are at a minuscule Rs 43,000 crores of assets. Gross flows into Gilt funds have already grown five times compared to last year. But the absolute number at Rs 3,400 crores is still very small compared to the more than Rs 1,00,000 crores that is the gross flows into equity funds. Gilt funds with 10 year constant duration which are likely to be the biggest beneficiary of any interest rate cuts saw an inflow of Rs 113 crores. Both these categories have also seen outflows. Clearly, they are not playing the duration game but are comparing their returns with equity schemes. Credit risk and Banking and PSU Bond funds should also be the beneficiaries of the interest rate cutting cycle. However, these funds have been seeing consistent outflows suggesting that duration based investing may not be happening at the moment.

Mutual Fund flows in August 2024

In this post, we analyse the assets and the flows in India’s mutual fund industry in the month of August 2024.

Total Assets Under Management (AUM):

Total AUM of all schemes was close to Rs 66.7 lakh crores as on August 31, 2024. As we had predicted last month, the AUM comfortably crossed the 65 lakh crores mark. It grew 2.6% over the previous month and more than 43% over last August 2023. That’s an impressive growth over a year. At a 3% growth rate, the AUM will cross 80 lakh crores by the end of this fiscal and cross Rs 10 billion crores in FY 26. Equity and Hybrid AUM have grown 62% and 53% over last year. Debt funds AUM grew by 14% as even Index funds AUM grew by 47%. We have always maintained that in a country which has large exposures to gold and fixed income as asset classes, the mutual fund industry has been unable to penetrate these two products with the investors. In this situation where equity indices are over valued, diversion of some funds into debt may have worked in the interest of investors.

Equity and Hybrid schemes

Net sales in equity schemes was flat compared to the previous month. However, both gross sales and redemptions were lower than July 2024. Sales were down 8% but redemptions were down 22%. More than a third of the sales in equity schemes is in Sectoral schemes. Close to 50% of the net flows are in sectoral schemes. Focussed funds and ELSS funds are seeing net outflows.

Net inflows in hybrid schemes were down almost 43% mostly due to a 27% decline in gross inflows into arbitrage funds. Five sectoral funds raised Rs 10,200 crores whereas ten index funds raised 884 crores. This tells you the story of how retail has been left out of the index part of the industry.

There were two NFOs (one ETF and one mutual fund) of the Nifty 500 Multicap 50:25:25 index. This index will invest 50% in large cap shares and 25% each in mid cap and small cap shares. The weights of each of the sub-class of assets is based on their market capitalisation. Let us see how this index compares to the Nifty 500 index and the Nifty 500 Largemidsmall Equal cap Weighted Index. The Nifty multi cap index has given a return of 26.42% over the last five years compared to 22.73% for the Nifty 500 index. The Equal cap index has given a return of 28.47% over the last five years which not surprisingly is the highest amongst all the three Nifty 500 indices. This is so because the Nifty 500 index would have a lower exposure to mid and small caps and given their outperformance over the last few years, it is not surprising that the Nifty 500 Equal weighted index would have outperformed the Nifty 500 index and the 50:25:25 index. Those looking for lower risk should consider the Nifty 500 index while those with a longer term horizon and higher risk appetite should consider the Nifty 500 multi cap index. Those with an even higher risk appetite should look at the equal weighted index. One of these schemes should actually make up almost 50% of one’s equity exposure. The rest can be allotted to active investing especially in mid and small caps where the possibility of alpha still exists.

Debt (Fixed income) schemes

Net inflows in debt schemes was down 63% as it was the middle month of the quarter. We are almost at the end of September and we also had an advance tax date on the 15th, which will ensure that September will see net outflows from debt schemes mostly driven by institutional investors.

Gilt funds with 10 year constant duration only have Rs 4,500 crores of AUM. Other gilt funds have Rs 33,300 crores of AUM. Given that the Fed has already announced a 50 bps cut in interest rates and with inflation moderating in India, it may be time for RBI to start their rate cutting cycle. In such a scenario, debt funds which adopt a duration strategy can see a gain of 6 – 8% for every one percent cut in interest rates. However, these funds have not seen any major change in their AUM or flows over the last two months. The number of folios in these schemes is also negligible. There are five funds in the 10 year constant duration category. The folios in this category are 36,301 and the folios in the other gilt funds are 192,867 and they have an AUM of Rs 33,300 crores.

Those who have a debt exposure could consider investing in these schemes to take advantage of the increase in prices of these securities when interest rates move down.

Mutual Fund flows in July 2024

In this post, we analyse the assets and the flows in India’s mutual funds industry in the month of July 2024.

Total Assets Under Management (AUM)

Total AUM of all schemes was close to Rs 65 lakh crores. They would have crossed this number by now and we can be sure that the August month end numbers will cross the 65 lakh crs mark. This is a 6.23% growth over the previous month. Total AUM was Rs 46.37 lakh crs in July 2023. The jump of 40% is substantial. AUM of equity oriented schemes jumped by 61% over a year. These are the money making schemes for Asset Management Companies and the bottom-lines of these companies will see a huge increase in the current financial year. AUM of Hybrid schemes has also shown a very good growth of 53.45%. Most of this growth seems to have been driven by Arbitrage schemes. Their AUM increased from Rs 90,745 crs to 189,349 crs. Are all the profit booking flows invested here? Are people switching out from Equity to Arbitrage schemes or are they redeeming from equity schemes and investing in Arbitrage schemes? We need more data to determine the answers to these questions.

Are investors trying to time the markets? Will they get back in once the markets reach a reasonable level. How will they determine what level is reasonable? Are their advisors good enough to give them this advice? Should the advisors not be focussing more on ‘time in the market’ rather than ‘timing the market’?

Equity and Hybrid schemes

Gross inflows in equity and hybrid schemes in the month of July were mostly unchanged compared to June 2024. Gross inflows have doubled over July 2023. Gross inflows in these schemes increased to Rs 127,000 crs from Rs 64,000 crs. Net inflows in July were ten percent more than in June. They were at Rs 54,500 crs. Net inflows in July were a whopping 272% more than last year. Last year net inflows were only Rs 20,000 crs. This is a very large increase and probably one of the reasons why markets are either stable or creeping up. Net inflows in mid cap and small cap funds are lower than last year. Old investors are booking profits. But new investors seem to be attracted by the good returns over the last few years.

Most of the gross inflows still come to sector schemes. There were two NFOs which garnered 9,790 crs of assets. Gross inflows in sector funds last year was Rs 6,192 crs which have increased to Rs 27,468 crs in July 2024. Net inflows have grown from Rs 1,429 crs to Rs 18,386 crs. That’s a massive jump. The second biggest category was multi cap schemes followed by Flexi cap schemes. Mid caps and small cap funds raked in Rs 7,000 crs each approximately.

Are investors investing in sector funds as also mid and small cap schemes based on their strategic asset allocations? Or are they just investing in these funds from a tactical perspective? Does it make sense to invest in the markets at these levels. Most market participants believe that there is value only in large caps. However, large cap schemes are seeing very less net inflows in July as well as in June this year and the story must be the same for the rest of the months. Last year, in fact, they saw net outflows. Are investors expecting the market to keep giving double digit returns over the next few years. Will they be disappointed if they see single digit returns and if that happens, will they stop investing or even worse redeem to chase that asset class which has given higher returns. And which asset class will that be that will be the next multi-bagger? Are AMCs doing the right thing by launching so many new schemes and garnering AUM in sector schemes? Are they being customer centric or only AUM and hence bottom line focussed? Do they consider the present value of a customer who invests with them for a life time vis a vis a customer who invests in the hope of quick and high returns and leaves after getting disappointed. Are advisors advising their clients that they may have to stay invested for much longer periods from now onwards compared to what they have seen in the past. Long term returns are around 20%. Markets may have to see a correction in order to revert to the mean and nobody knows whey that will happen, how deep will it be and for how long will it last.

There are 174 sector schemes. They have 2.47 cr folios out of the total 19.84 cr folios. They are followed by small cap schemes with 2.08 cr folios. ELSS, Flexi and mid cap funds have 1.5-1.6 cr folios. None of the hybrid schemes have more than 1 cr folios. The largest being Aggressive Hybrid funds with 55.1 lakh folios. Not surprisingly, Arbitrage funds have only 5.32 lakh folios confirming our theory that funds which have a low trail rate are not generally sold by distributors. With a relation in the rules for Registered Investment Advisors (RIA), their numbers will increase leading to an increase in these numbers. We have generally been getting our clients to invest in Arbitrage Funds to take advantage of the lower tax rate of 20% (from 15% earlier). We recommend an STP from Arbitrage funds into equity funds. This may help clients reduce their average cost of purchase in a volatile market. Ideally, we would have waited to start investing in equity. However, with such inflows, it does not seem that a large correction may happen soon. In any case, we only invest in equities if the client has a long enough time horizon else we look for safer investments for them.

Surprisingly, other ETFs have 1.22 cr folios and Rs 5.54 lakh crs assets. This is surprising. Does it mean that these ETFs are used for trading purposes rather than for long term investments? More data on the same can help answer this question.

Debt (Fixed Income) schemes

Debt assets increased to Rs 15.95 lakh crs compared to Rs 14.55 lakh crs last year showing an increase of 9.6%. Money market funds have shown a good increase to rising to Rs 2.25

lakh crs from Rs 1.48 lakh crs. With interest rates supposedly at their peak, gilt funds have hardly shown any movement and have assets under management of Rs 37,000 odd crs.

The last month saw net outflows of 1.07 lakh crs and this month the money came rushing back in to the tune of Rs 1.19 lakh crs. Fifty eight percent of the net inflows was in liquid funds. But a lot of funds came into money market funds. This will likely be stable this month and again the story of outflows will be repeated in end September.

Mutual Fund flows in June 2024

In this post, we analyse the flows in India’s mutual funds industry in the month of June 2024.

Equity and Hybrid schemes

Our pet peeve refuses to go away. Sector/Thematic funds continue to garner more funds than any other equity mutual funds category. They collected Rs 30,708 crs in June compared to Rs 25,959 crs in the previous month. Nine sectoral NFOs garnered Rs 12,974 crs. These were quant funds, Manufacturing funds, Special opportunities funds, etc. Clearly, AMCs are making hay while the sun (funds inflow) is shining though rains have really picked up as I pen this. Hope the sun will keep shining on all these investors.

There were three Special Opportunities fund NFOs in the last month. First, we thought that these were Special Situations Funds. Special Situations funds invest in companies that are undergoing some merger or acquisition or a similar such situation due to which an opportunity is created to generate alpha. But what are special opportunities funds? Isn’t all buying supposed to be special opportunities or you might as well buy the index. Looks like Special situations and special opportunities aim to do the same thing ie generate alpha from companies that are facing a special situation. We are doing an analysis of these sector funds and will cover their risk and return characteristics in another blog.

Arbitrage funds saw a dip in net inflows. Maybe a portion of these funds were transferred to the NFOs. That would mean that investors are parking their funds in tax efficient schemes and investing in NFOs or other schemes.

Hybrid funds are quite a large category. However, their inflows are smaller compared to the mid cap and small cap schemes. This also makes you ponder that are schemes still being sold based on past performance. And if that is the case, when will it change?

Assets of Hybrid funds are a third of the assets of equity schemes but their net flows are only 20% of equity schemes. These may pick up at a later date.

Assets of other schemes crossed Rs 10,00,000 crores. These are mainly Index funds, Gold Exchange Traded Funds (ETFs), other ETFs and Funds investing in overseas equities. This is an important milestone. These assets are now almost 25% of active assets. And this is a good sign. These assets mainly belong to Institutions. Unfortunately, Index Funds and Debt Funds have majority of the assets from institutions who do not need an advisor. These will never be recommended by normal advisors who make peanuts on such funds. SEBI made these funds non-lucrative for advisors and distributors when they abolished different plans for different classes for investors. That was a nice way for investors to be offered these funds if they wanted them. In those times, there were retail plans in liquid funds whose expense ratio was probably 0.5 – 0.65% whereas institutional and super institutional plans had a higher minimum amount to invest but much lower expense ratios. Maybe its time to bring that regime back.

Debt (Fixed Income) schemes

Its the end of the quarter and as mentioned in one of our earlier memos, net inflows into debt schemes turned negative. They dropped from + Rs 42,294 crs to – Rs 107,357 crs. Most of the debt schemes saw an outflow. But Liquid and Overnight funds saw the most outflows. All the outflows would have happened at the end of the quarter since the average AUM of debt schemes was Rs 15,18,838 crores during the month but dropped to Rs 14,13,232 crs at the end of the month. Most of the money market instruments mature during or near quarter ends to enable liquid funds to manage their liquidity. The most popular papers would be three months or less papers followed by two month papers. And there will be some trading in these papers by smaller funds who see an unexpectedly large inflow or outflow during the quarter.

Floater funds have seen outflows for the last two months. And rightly so as you should lock in the higher interest rates at this time and not get into floater funds.

The link to the AMFI report on June 2024 flows is below:
https://portal.amfiindia.com/spages/amjun2024repo.pdf

Analysis of Risk Parameters of Small Cap Mutual Fund Schemes

Sebi requested Asset Management Companies which manage mutual funds to disclose certain parameters related to liquidity, risk and turnover as well as client holdings every month for mid and small cap schemes. Reports are available for these schemes for the months from February to April 2024. We had recently analysed the parameters for mid cal schemes. Our observations on the parameters disclosed for small cap schemes are as under:

Exposure to small cap stocks

Small cap schemes need to have a minimum 65% exposure to small cap stocks. These stocks rank 251 to 500 in the list declared by AMFI every month. The largest small cap stock had a market capitalisation of Rs 22,127 crs on an average in the six months period ended December 31, 2023. The 500th stock in the list had a market cap of Rs 7,314 crs. The largest small cap fund is Nippon India Small Cap Fund with assets of Rs 50,413 crs in April 2024 and the smallest fund managed Rs 47 crs.

The Tata fund has the largest exposure to small companies at 93%. Four funds had an exposure of more than 87% to smaller companies. The fund with the least exposure at 64.9% is ITI Fund and ICICI Pru, Motilal Oswal and Quant had exposures to small caps less than 70%. The largest exposure to large cap stocks was of Quant at 26.95%. Nippon, Mahindra and ITI had large cap exposures of more than 10%. The largest amount of cash was with ICICI at 10.64% followed by Bandhan at 10.38%. There are funds will cash levels
less than 2%. One would expect AMCs to have less exposure to large caps and more to mid caps given that investors are looking for a high risk reward ratio.

Holdings concentration

ITI had the largest holdings of the top ten investors at 20% followed by Mahindra, Motilal and Bandana in the early tens. You will recall that having high concentration is not good but one must also consider the overall size of the fund. These funds are not too large and should be able to manage their liquidity.

Liquidity

HDFC will take the maximum number of days (54) to liquidate half its portfolio of Rs 29,600 crores whereas the largest Fund Nippon will take 31 days only. SBI will also take 48 days to liquidate half of its Rs 27,700 crs assets. Kotak with 14,800 crs of assets will also take 35 days which is higher than Nippon. If you are the type who will redeem then these numbers are important for you.

Risk Parameters

Quant has the highest standard deviation at 19.2% and the highest portfolio turnover ratio at 1.52 times. Motilal and bandana have single digit standard deviation and low turnovers too.

  1. Choose funds which have high liquidity (ie those funds who can sell their portfolio in the lowest number of days)
  2. Funds with less concentration of clients are better. We have seen with debt funds that the smartest investors are the first to redeem leaving the rest with all the ill-liquid assets.
  3. Choose funds with low standard deviation and low portfolio turnover ratios. It’s a pity that Sharpe ratios are not disclosed here. But higher the Sharpe ratio, better is the fund.
  4. Choose your fund carefully. Some of the funds are small and large cap funds and some are small and mid cap funds. If you already have a large cap exposure, choose funds with high small and mid cap exposures.

The link to the AMFI report on small cap schemes for April 2024 flows is below:

https://www.amfiindia.com/riskparameter

Mutual Fund flows in April 2024

In this post, we analyse the flows in India’s mutual funds industry in the month of April 2024. A link to our analysis for the analysis of the flows in March 2024 is given below. A link to the April 2024 AMFI flows report is also appended below.

Equity and Hybrid schemes

Gross inflows in equity and hybrid funds were mostly unchanged from April. An uptick was mainly seen in Arbitrage Funds. Net inflows into equity funds did see a fall from 22,000 crs to 18,900 crs. Small cap funds which saw higher redemptions in March 2024 saw lower redemptions in April leading to positive net inflows. Thematic funds continued to lead in the net inflows.

A thematic fund based on innovation garnered Rs 700 crs in its NFO in April 2024. An NFO for retirement solutions managed to collect Rs 40 crs. Clearly, people are more excited investing in Innovation than on their retirement. Six index funds collected Rs 269 crs. They were all launched by one AMC.

Sebi’s rule of creating fund categories, defining them tightly and allowing each AMC only one scheme in most categories has made life simpler for investors. Older AMCs can launch schemes only in the thematic and Index funds categories. These are also being driven by the new indices that are being created. The more the indices, the more the ability of the AMCs to launch new schemes.
Scheme categorisation has also allowed an easy comparison of the performance and risk characteristics of large cap funds, flexi cap funds, etc. It may still be a challenge for funds where the minimum investment is at a lower threshold say mid cap and small cap funds or even dynamic allocation funds as AMCs have the flexibility to invest the balance funds in all kinds of equity and even debt. Accordingly, the comparison of such schemes should be based on their asset allocation.

Flexi cap funds have the most assets followed by sectoral, large cap, mid cap and then small cap funds. Mid cap funds may become larger than large cap funds. Small cap funds are already larger than ELSS funds. This may prove that it is still past performance that is driving sales into these schemes. Investor should stick to their asset allocations and not chase returns.

Debt (Fixed Income) schemes

The inflows and outflows into debt schemes are 10-12X of those into equity schemes. But nobody seems to notice the same. The liquid and overnight funds are second only to Other ETFs. They collected Rs 8,63,000 crores between them. They offer good returns and great flexibility and are a good substitute for those keeping more than Rs 25,000 in their bank accounts.

Money market funds can play an important role in your debt portfolio as the duration is low, liquidity is good and one can generate decent returns with great flexibility. These collected Rs 61,000 crs in April. We are certain that most of them must be from corporates and HNIs.

Conservative Hybrid Funds are also nice schemes for those who are ultra conservative but still crave for a double digit return. However, their flows and assets are abysmal.

Multi Asset Funds which have provided double digit returns with low volatility are also not very popular and fare a little better than CHFs in terms of assets.

The Industry could do well to promote these categories of funds.

The link to our our analysis of March 2024 inflows is below:
https://www.linkedin.com/feed/update/urn:li:activity:7188159761790496768/

The link to the AMFI report on April 2024 flows is below:
https://portal.amfiindia.com/spages/amapr2024repo.pdf

Mutual Fund flows in May 2024

In this post, we analyse the flows in India’s mutual funds industry in the month of May 2024.

Equity and Hybrid schemes

Gross inflows in equity funds grew in May compared to the previous month by . Hdfc Manufacturing fund collected Rs 9,563 crs. Even excluding the same, gross inflows in equity funds grew 11.45% percent over April 2024 and by a whopping 231% over May 2023. Net inflows were Rs 34,697 crs which were more than the gross inflows in May 2023. Thematic funds continue to get the maximum gross inflows. Focussed and ELSS schemes were the only two categories with negative inflows. Mid cap funds saw a surge in gross inflows this month.

There seems to be consistent profit booking in equity and hybrid schemes. Inflows in Arbitrage schemes grew a lot suggesting that investors are booking profits and moving into arbitrage schemes. Are they waiting for a correction to enter again? The power of compounding works over a long period of time. So investors should stay invested and not try to time the markets.

Assets in sectoral schemes were equivalent to flexi cap schemes in May 2023 but are now more than Rs 58,000 crs. Shows the popularity of these schemes in the last year or so. There will always be one particular sectoral theme that will be outperforming the market. The rest will be underperforming the market. It is difficult to determine the sector that will do well and hence a flexi cap scheme should provide consistent returns year on year as the fund manager has the flexibility to move between sectors as well as between large and other companies.

Gross inflows into index funds and ETFs have also doubled over the last one year. Will a correction happen with an almost Rs 50,000 net inflows from mutual funds into equity markets?

Debt (Fixed Income) schemes

As expected, net inflows into debt schemes plummeted by 78% to Rs 42,294 crs. This was after the surge in net inflows in April. We are likely to see net outflows in the next month due to quarter end.

Banking and PSU Bond Funds are a good proxy for those investing in fixed deposits. They are superior to FDs are they provide diversification as well as liquidity compared to CDs. Investors can easily do Systematic Withdrawal Plans (SWP) from these funds to fund their monthly expenses. Unfortunately, these do not seem very popular as the assets of these funds are Rs 81,000 crs whereas fixed deposits with banks are more than 1,84,00,000 crs more than 227 times of a surrogate product. Distributors would do well to recommend Banking & PSU funds to customers looking at investing in fixed deposits.

The link to the AMFI report on May 2024 flows is below:
https://portal.amfiindia.com/spages/ammay2024repo.pdf

Analysis of Risk Parameters of Mid Cap Mutual Fund Schemes

Sebi requested Asset Management Companies which manage mutual funds to disclose certain parameters related to liquidity, risk and turnover as well as client holdings every month for mid and small cap schemes. Reports are available for these schemes for the months from February to April 2024. Our observations on the parameters disclosed for mid cap schemes are as under:

The largest fund, Hdfc Mid Cap Opportunities Fund will take 26 days to liquidate 50% of its portfolio of Rs 63,409 crs. While Kotak Emerging Equity Fund with Rs 42,681 crs will take 27 days to liquidate 50% of its portfolio. The SBI Magnum Mid Cap Fund with Rs 17,915 crs will also take 25 days. Funds with Rs 10,000 crs of assets will take 5-7 days to liquidate 50% of their portfolio. DSP Mid Cap Fund with Rs 17,000 crs of assets will take 14 days for the same. HSBC and PGIM seem to be doing a better job here. Clearly, liquidity differs from fund to fund and choosing a fund with better liquidity should be one criterion for choosing a mid cap fund. So the smaller funds will fare better here and bigger the better may not work here.

Out of the 29 funds, only four funds have an exposure to mid cap companies which is more than 70%. Remember Sebi requires that these funds invest at least 65% in mid cap companies (companies which rank 101 to 250 in the list of largest companies based on market capitalisation. A list released by AMFI every January and July).

Hdfc is sitting on the most amount of cash at 8.4% followed by Motilal Oswal at 7%. So most are almost fully invested irrespective of all the talk of mid and small caps being overvalued. Nobody wants to miss out if the markets keep rising.

The balance funds can be invested in large or small caps and its interesting to note that Quant has the highest allocation to large cap at 25% and consequently one of the lowest allocation to small caps at 0.62%. There are five other funds with an allocation of close to 20% to large caps. The largest allocation to small caps is of JM with 30% followed by Taurus and then followed by Tata, White Oak and UTI.

Motilal Oswal has the highest allocation to large caps at 22% followed by JM at 14%. The rest are significantly below 5%.
The highest annualised standard deviation is 16.65 and almost all funds are in the range of 12-15% whereas Invesco is the lowest at 3.93%. Wonder what Invesco is doing unless there is a typo here.

Interestingly, almost all funds have a portfolio beta less than 1. P/E ratios of funds also show a huge range from 21.39 for HDFC and 57 for Bandhan’s fund.
Portfolio turnover ratios show an anomaly for Franklin Prima Fund which is at 23.4 whereas the rest are mostly in low single digits whereas some are less than zero too. We have highlighted the above to AMFI. We checked the Franklin Fact sheet and the number for Franklin seems correct which means the others have to be reported as a percentage and seem to have been reported as a decimal. Assuming that the decimals are actually percentages, Quant has the highest turnover at 3.2 followed by White Oak at 2.54 which suggests very high churn.

Further, JM and Motilal have the highest concentration in terms of customer holdings. The top ten customers are 22% of Motilal’s assets and 14% of JM’s assets. In case of a issue, it may be possible that the most liquid assets are used to pay off these customers first who invariably will probably will be the first to redeem in case of any signs of trouble.

So here’s how to use these data:

  1. Choose funds which have high liquidity (ie those funds who can sell their portfolio in the lowest number of days)
  2. Funds with less concentration of clients are better. We have seen with debt funds that the smartest investors are the first to redeem leaving the rest with all the ill-liquid assets.
  3. Choose funds with low standard deviation and low portfolio turnover ratios. It’s a pity that Sharpe ratios are not disclosed here. But higher the Sharpe ratio, better is the fund.
  4. Choose your fund carefully. Some of the funds are mid and small cap funds and some are mid and large cap funds. It would make sense to up the minimum to 80%.

The link to the AMFI report on mid cap schemes for April 2024 flows is below:
https://www.amfiindia.com/riskparameter

Where are the retail investors in debt mutual fund schemes?

Debt mutual fund schemes continue to elude retail investors. Total inflows into debt mutual funds continue to be higher than equity inflows. Total inflows into debt mutual fund schemes in April 2022 was Rs 743,606 crores vis a vis Rs 73,437 crores in equity schemes including index and other ETFs. Of the 13 crore folios in open ended schemes, almost 94% are in equity schemes and only about 73 lakh folios are in debt schemes. The assets of Debt mutual fund schemes is Rs 13,91,308 crores which is 36% of the total assets in open ended schemes. Clearly, 36% of the assets of all open ended schemes are contributed by only 6% of the folios. No prizes for guessing that debt schemes are generally being bought by either institutional investors or by Ultra High Net worth Individuals or High Networth Individuals. Retail investors seem to be oblivious of these scheme categories which are a great way of getting exposure to diversified and liquid debt portfolios. The average value of a folio in debt schemes is Rs 19 lakhs whereas the same in equity schemes is Rs 1.6 lakhs and hybrid schemes is Rs 4 lakhs. Clearly, the retail investor is giving the entire debt category a miss.

The reasons for the same are not hard to fathom. The commissions earned by distributors on debt schemes will range from 0.1% for liquid schemes to 0.4/0.6% for long term debt schemes. Further, the returns are also volatile as NAV changes with changes in interest rates. Accordingly, it is easier to invest these funds in either fixed deposits with banks and NBFCs or in bonds and debentures. The prices of Fixed Deposits are not marked to market and hence there is no capital gains or losses. The bonds and debentures are marked to market. However, since investors may not look at their demat statements every day, these are unlikely to cause a flutter. The issue with Fixed Deposits is that they are not liquid and premature withdrawals are penalised by NBFCs. Firstly, the interest rate is reduced to the rate that was applicable to the period at the time of making the investment and a further penalty of around 2% is charged for withdrawal. This penalty is not leviable for mutual funds. There is an exit load which may be levied upto one year but there will be no load thereafter. Investors need to consider debt mutual funds schemes for the following benefits:

  • Liquidity – Mutual funds provide instant money. Redemption applications made before 3 pm on an working day will provide funds before 10 am of the next working day;
  • Lower tax rates – Taxes on long term capital gains (ie capital gains earned after holding the units for more than three years) is 20% after indexation. Accordingly, the tax rate will be much lower compared to an FD for customers whose annual taxable income is more than Rs 10 lakhs
  • Diversification – Mutual fund schemes invest in debt papers of different companies in different industries. This assists in diversification of investments. As has been seen with investors of certain banks that faced RBI action, putting all your eggs in one basket is risky and it makes sense to invest in diversified debt schemes rather than chase high returns by investing everything in one issuer and ignoring risk;
  • Review of investments: It is the fund manager’s role to keep track of the credit risk of their investments. They are likely to determine an imminent credit event far earlier than a common investor. Of course, given the inherent nature of our market it is possible that mutual fund schemes also end up with credit losses. However, it is likely that the entire portfolio may not get impacted due to such events.

Investors would do well to ensure that their emergency funds are all invested in liquid and ultra short term bond schemes. These are typically 6-8 months of their normal monthly expenses. Further, almost 50-60% of the total debt allocation should be invested in debt mutual fund schemes. Almost all the exposure that is meant for more than three years should be in debt mutual funds. Corporate bond schemes are an ideal investment vehicle for this purpose. Banking and PSU debt schemes will also be ideal for credit risk averse investors. These schemes take exposure to bank debt or those of PSUs, which are considered by investors as safer than private corporates. The average returns of these schemes over three years is 7.29 and that over five years is 7.11. These schemes manage assets of Rs 92,000 crores in April 2022, a miniscule amount compared to the amounts invested in Fixed Deposits which may be more than Rs 14,00,000 crores.

In March 2022, index funds in debt raised close to Rs 3,000 crs. In April, there were no issues of such funds. Clearly, HNIs are using these funds to improve their after tax returns by making use of indexation benefits and staying away from volatile equity markets. It remains to be seen that over a three year period, after markets have corrected by 15% from their peak, whether this will be considered as a smart move. Again, this data clearly shows that the retail investor is missing out on the debt schemes space altogether.

Equity fund flows:

Gross inflows into equity funds fell from 46,400 crs to 32,600 crs. Contrary to popular belief, there is no fall in inflows. There was a large SBI multi cap NFO in March which garnered Rs 8,170 crs. If you take away this NFO, the inflows in March and April are quite similar. In April, ICICI had a thematic fund NFO which raised Rs 3,130 crs. This NFO bolstered the thematic fund inflows in April 2022. The AUM of thematic funds is amongst the highest amongst all categories of equity funds. Thankfully, balanced advantage funds is the only category that is larger than thematic funds. The size of thematic funds and the continued inflows into NFOs suggests that the distribution market in India is still to mature. Investors may do well to review their investments and stay away from NFOs unless the same are new in the market altogether and stick to medium sized schemes with a decent past record of performance. Further, thematic funds by their nature are likely to be more volatile than broadly diversified schemes. While thematic funds can be a part of large portfolios, their presence in portfolios of smaller investors should be a cause of worry. Distributors would do well to stick to diversified funds for their smaller clients.